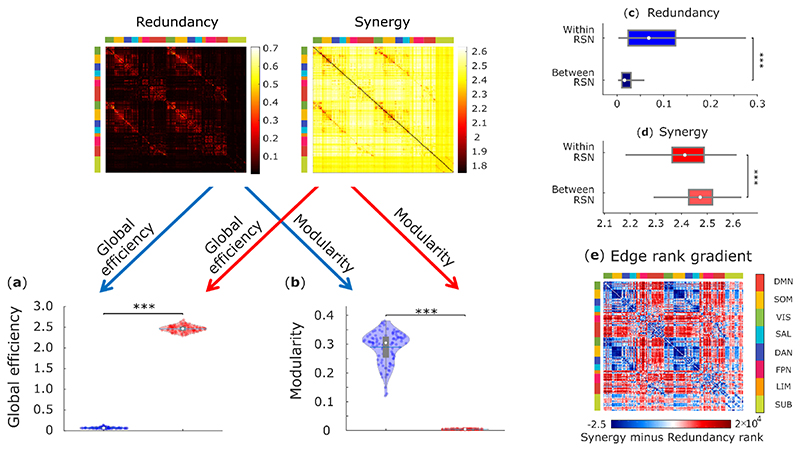
Fig. 3. Network analysis indicates global and segregated processing for synergy and redundancy, respectively.
(a) The whole-brain network organization of synergistic interactions exhibits significantly higher global efficiency than the whole-brain network of redundant interactions (Synergy: M=2.47, SD=0.08; Redundancy: M=0.07, SD=0.02; t(99)=-285.75, p<0.001, Hedges’s g=-43.58, effect size CI: [-50.46, -38.75], from paired-sample non-parametric permutation t-test (two-sided); n = 100 unrelated HCP subjects). (b) The whole-brain network of redundant interactions exhibits significantly higher segregation (modularity) than the network of synergistic interactions (Synergy: M=0.003, SD=0.001; Redundancy: M=0.29, SD=0.05; t(99)=52.12, p<0.001, Hedges’s g=7.28, effect size CI: [6.22, 8.85], from paired-sample non-parametric permutation t-test (two-sided); n = 100 unrelated HCP subjects). For the violin plots in both (a) and (b), each colored circle represents one subject; white circle: median; central line: mean; box limits, upper and lower quartiles; whiskers, 1.5x inter-quartile range; *** p < 0.001. (c) Redundant connections are significantly stronger within functional resting-state subnetworks than between them (Within-RSN: M=0.087, SD=0.078, n=7178 within-RSN connections; Between-RSN: M=0.026, SD=0.027, n=46414 between-RSN connections; t(53590)=127.45, p<0.001, Hedges’s g=1.61, effect size CI: [1.58, 1.66]; from two-sample non-parametric permutation t-test (two-sided)). (d) Synergistic connections are significantly stronger between functional resting-state subnetworks than within them (Within-RSN: M=2.41, SD=0.09, n=7178 within-RSN connections; Between-RSN: M=2.47, SD=0.06, n=46414 between-RSN connections; t(53590)= -75.31, p<0.001, Hedges’s g=-0.96, effect size CI: [-0.99, -0.92]; from two-sample non-parametric permutation t-test (two-sided)). For the box-plots in both (c) and (d): white circle represents the median; box limits, upper and lower quartiles; whiskers, 1.5x inter-quartile range. (e) Matrix of redundancy-to-synergy gradient scores for each connection between brain regions, highlighting regions’ affiliation with the resting-state subnetworks of Yeo et al. (2011). Red indicates synergy > redundancy. These results are robust to the use of alternative ways of defining nodes and edges, and alternative network measures (Extended Data Fig. 3-5 and Supplementary Tables 3-4).

