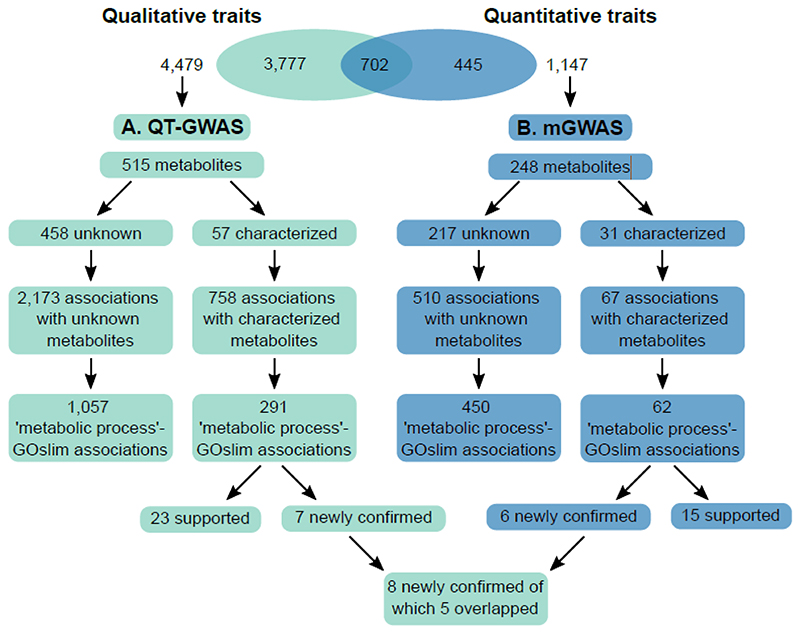
Figure 1. Schematic overview of the qualitative and quantitative traits and their recorded associations.
A, 4,479 qualitative metabolic traits were used as input for the QT-GWAS. Associations were retrieved for 709 qualitative traits, estimated to correspond to 515 metabolites, of which 57 were characterized and 458 remained unknown. 2,173 associations were retrieved for the unknown metabolites, of which 1,057 involved loci encoding enzymes labeled with ‘metabolic process’-related GOslim categories. The 57 characterized metabolites were involved in 758 associations. In this dataset, 291 loci contained genes labeled with ‘metabolic process’-related GOslim categories. At least 23 of these associations were confirmed or supported by previous research and seven (involving three loci) were newly confirmed in this study. B, 1,147 quantitative traits were used as input for the mGWAS. Associations were retrieved for 288 of estimated to correspond to 248 metabolites. Of these metabolites, 31 were characterized and 217 remained unknown. The unknowns were involved in 510 associations of which 450 encompassed loci containing genes labeled with ‘metabolic process’-related GOslim categories. The 31 characterized metabolites were involved in 67 associations. In this dataset, 62 loci contained genes labeled with ‘metabolic process’-related GOslim categories, of which at least 15 were confirmed or supported by previous research and six (involving 3 loci) were newly confirmed in this study. In total, eight new associations were confirmed in this study of which five overlapped between the two methods.

