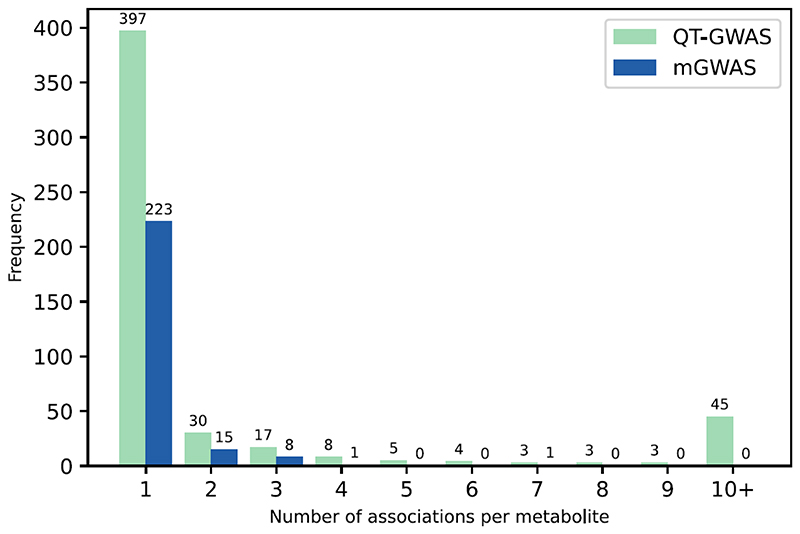
Figure 2. Distribution plot of the number of associations per metabolite retrieved for the 515 metabolites in the QT-GWAS (blue) and the 248 in the mGWAS (green).
Of the 515 metabolites associated in QT-GWAS, 397 show an association with one locus, 118 with two or more loci. In mGWAS, 223 metabolites showed an association with one locus and 25 to multiple loci.

