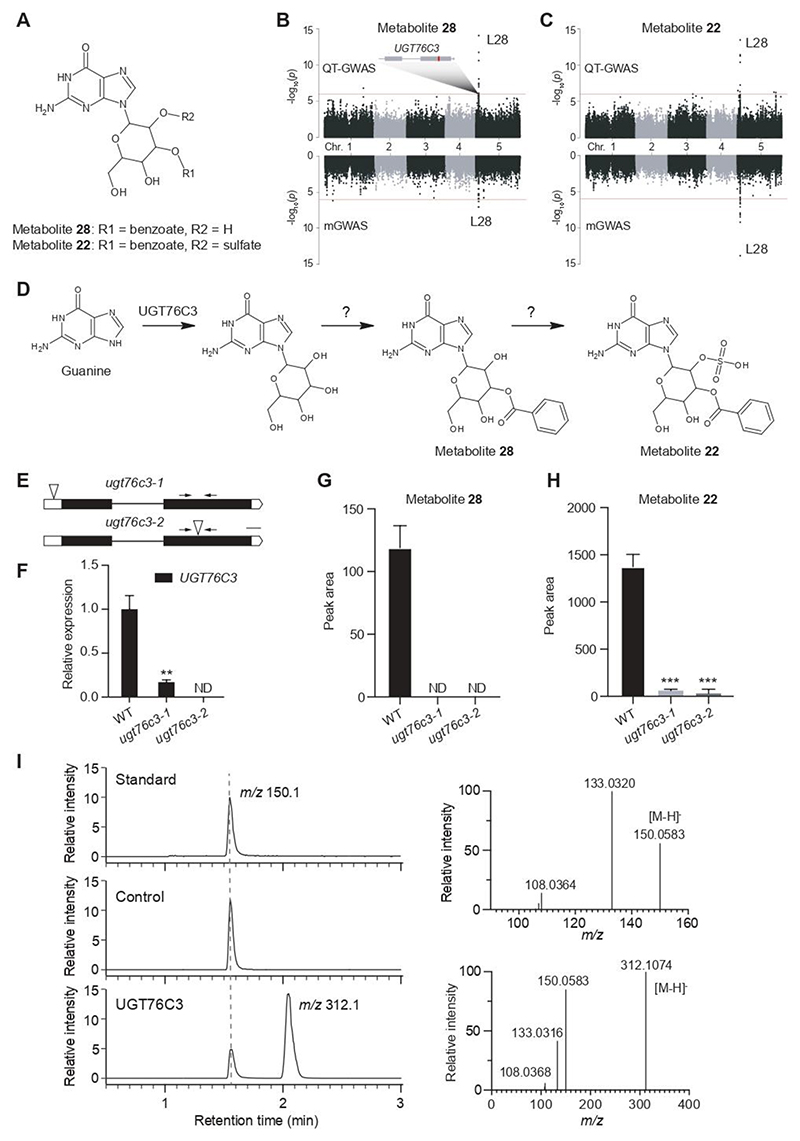
Figure 5. Overview of the UGT76C locus and its associated metabolites.
A: putative structure of associated metabolites 28 and 22. The sugar moiety is N-linked, but its exact position and that of the substituents R1 and R2 are unknown. B and C: Manhattan plots of metabolites 28 and 22 respectively, for QT-GWAS (upper panel) and mGWAS (lower panel): the x-axis represents the location of the recorded SNPs on the genome, the y-axis represents the negative logarithmic P-value for the association of each SNP to the respective metabolites. A schematic representation of the candidate gene (UGT76C3) in L28 is shown and the most significantly associated SNP is marked in red within the gene. D. Proposed pathway for the biosynthesis of metabolites 28 and 22 in which UGT76C3 catalyzes the first step, namely the hexosylation of guanine. E. Schematic representation of UGT76C3; intronic regions are represented by a line, exonic regions are indicated in black and UTR regions in white; insertion locations of the mutant lines are indicated by the triangles. F. Relative expression of UGT76C3 as determined by RT-qPCR, primers are indicated by the arrows. G and H. Comparative metabolite profiling shows a significant reduction of metabolites 28 and 22 in both mutant lines. Data are presented as mean ± SD, n = 5; ND, not detected. ***P-value < 0.001, **0.001 < P-value < 0.01. I. In vitro enzyme assays show the conversion of guanine to guanine glucoside in the UGT76C3 reaction exclusively (left panel). GST-tagged RFP was used as negative control. MS/MS spectral data confirmed the characterization of m/z 150.1 as guanine (right upper panel) and m/z 312.1 as guanine glucoside (right lower panel).

