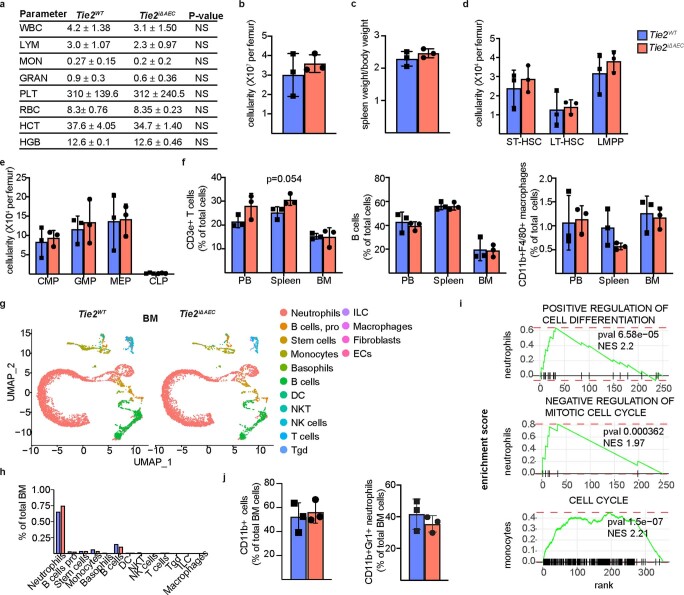
Extended Data Fig. 4. No difference in bone marrow leukocyte production between Tie2WT and Tie2iδAEC mice.
a. Peripheral blood cell counts indices in the Tie2WT and Tie2iΔAEC mice four weeks after Western diet. b-c. Quantification of BM cellularity and spleen weight/bodyweight in the Tie2WT and Tie2iΔAEC mice (n = 3 independent mice per group). d-e. Quantification of BM stem and progenitor cell numbers in the Tie2WT and Tie2iΔAEC mice (n = 3 independent mice per group). f. Quantification of CD3e+ T cells, B220 + B cells and CD11b + F4/80+ macrophages in the BM from the Tie2WT and Tie2iΔAEC mice (n = 3 independent mice per group). g. UMAP plots of (15) immune cell clusters from red blood cell-depleted total bone marrow of the Tie2WT and Tie2iΔAEC mice four weeks after Western diet with Immgen annotation. h. Quantification of immune cell clusters from the experiment. Values show mean ± s.d. Statistical significance was determined using Student’s t-test (two tailed, unpaired). i. Gene enrichment analysis showing pathways that are related the upregulated genes in the BM neutrophils and monocytes in the Tie2iΔAEC mice. P value adjustment is performed using a Benjamini-Hochberg (BH)-procedure (Multiple comparison test) as indicated in the fgsea package. j. Quantification of CD11b + cells and CD11b + Gr1+ neutrophils in the BM from the Tie2WT and Tie2iΔAEC mice (n = 3 per group). Values show mean ± s.d. Statistical significance was determined using Student’s t-test (two tailed, unpaired).

