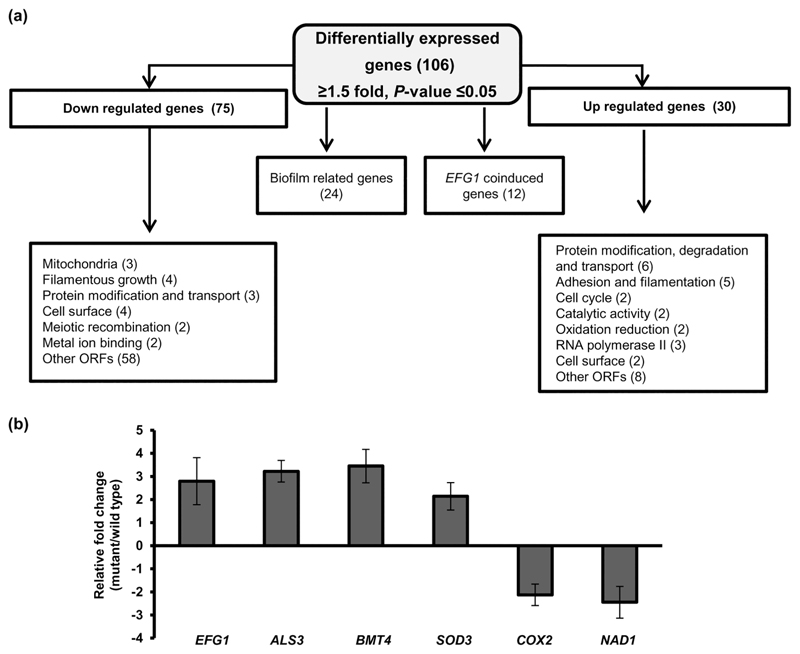
Figure 3. Transcriptional profiling of ifu5Δ/Δ cells.
(a) Flow chart indicating differential expression of genes in ifu5⍰/⍰. Boxes indicate list of functional categories according to GO annotation. Number of differentially expressed genes is indicated in brackets. (b) Quantitative polymerase chain reaction-based transcript analysis of Efg1 and its coregulated genes in ifu5Δ/Δ. Fold change (mutant/wild type) is calculated by 2-ΔΔCT, normalised to ACT1 (endogenous control) with untreated strain as calibrator. Values are means ± SD and are derived from three independent RNA preparations. A two-tailed, unpaired t test was used to determine the statistical relevance: ***p < .001

