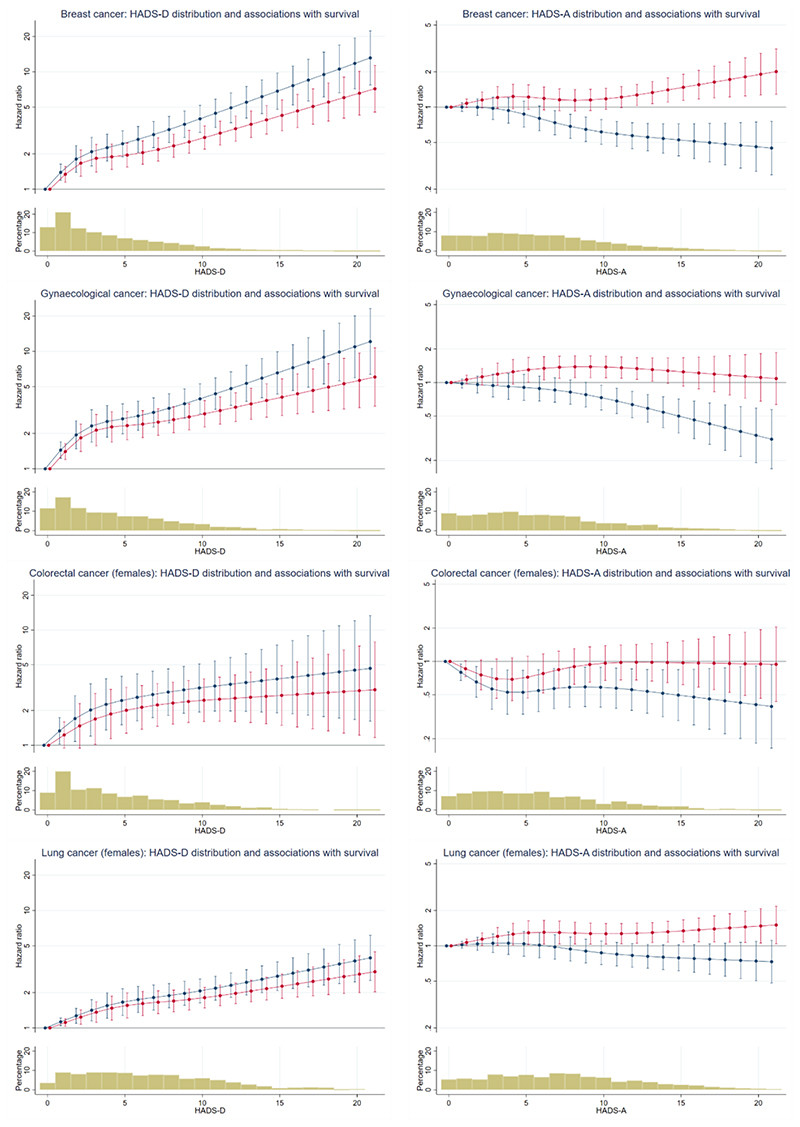
Figure 2. Associations of survival with depression and anxiety for female patients with cancer.
Plots show predicted hazard ratios (hazard of mortality for patients with each HADS-D or HADS-A score relative to patients with a score of zero). Bar Charts show the percentage of patients with each HADS-D and HADS-A score. Red lines show unadjusted hazard ratios (breast cancer HADS-D p<0.0001, HADS-A p=0.0220; gynaecological cancer HADS-D p<0.0001, HADS-A p=0.0398; colorectal cancer - females HADS-D p=0.0001, HADS-A p=0.1521; lung cancer - females HADS-D p<0.0001, HADS-A p=0.0656). Blue lines show the hazard ratios adjusted for the other symptom (depression or anxiety) of interest (breast cancer HADS-D p<0.0001, HADS-A p<0.0001; gynaecological cancer HADS-D p<0.0001, HADS-A p=0.0002; colorectal cancer – females HADS-D p<0.0001, HADS-A p=0.0371; lung cancer - females HADS-D p<0.0001, HADS-A p=0.0186). Note that y-axis scales are different for HADS-D and HADS-A, but consistent across cancers.

