Table 1. Biophysical Data for Selected Fragments Showing the Change in Protein Melting Temperatures (ΔTm), Binding Affinities (Kd), and Ligand Efficiencies (LE)a.
| Compound | Chemical structure | ΔTm (°C)b | MabPurC Kd (μM) | LEd |
|---|---|---|---|---|
| 1 |
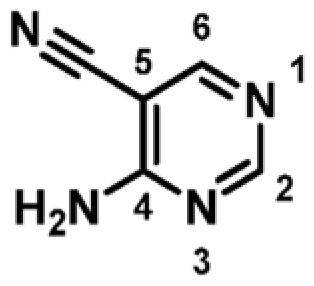
|
+3.6 | 341 ± 14 | 0.53 |
| 2 |
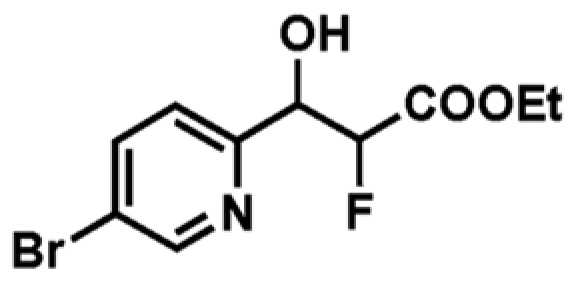
|
ND | ND | _ |
| 3 |
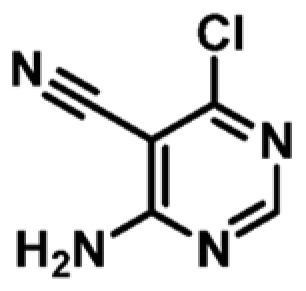
|
+4.0 | 159 ± 9 | 0.52 |
| 4 |
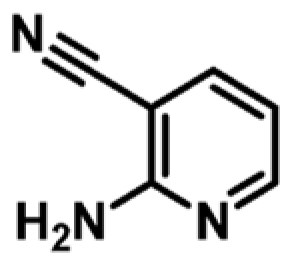
|
+1.7c | 1060 ± 252 | 0.45 |
| 5 |
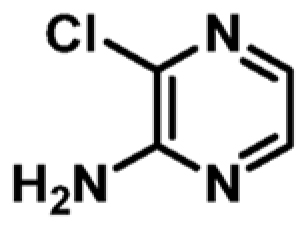
|
+1.0 | 971 ± 29 | 0.51 |
| 6 |
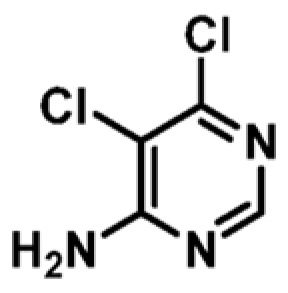
|
+2.5 | 442 ± 22 | 0.51 |
| 7 |
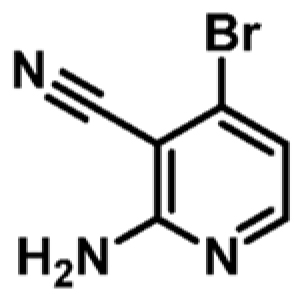
|
+1.7 | ND | _ |
| 8 |
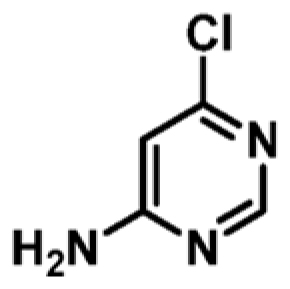
|
+0.7 | ND | _ |
ND not determined.
5 mM ligand and 100 μM MabPurC.
3 mM ligand and 70 μM MabPurC.
kcal mol–1 per heavy atom.
