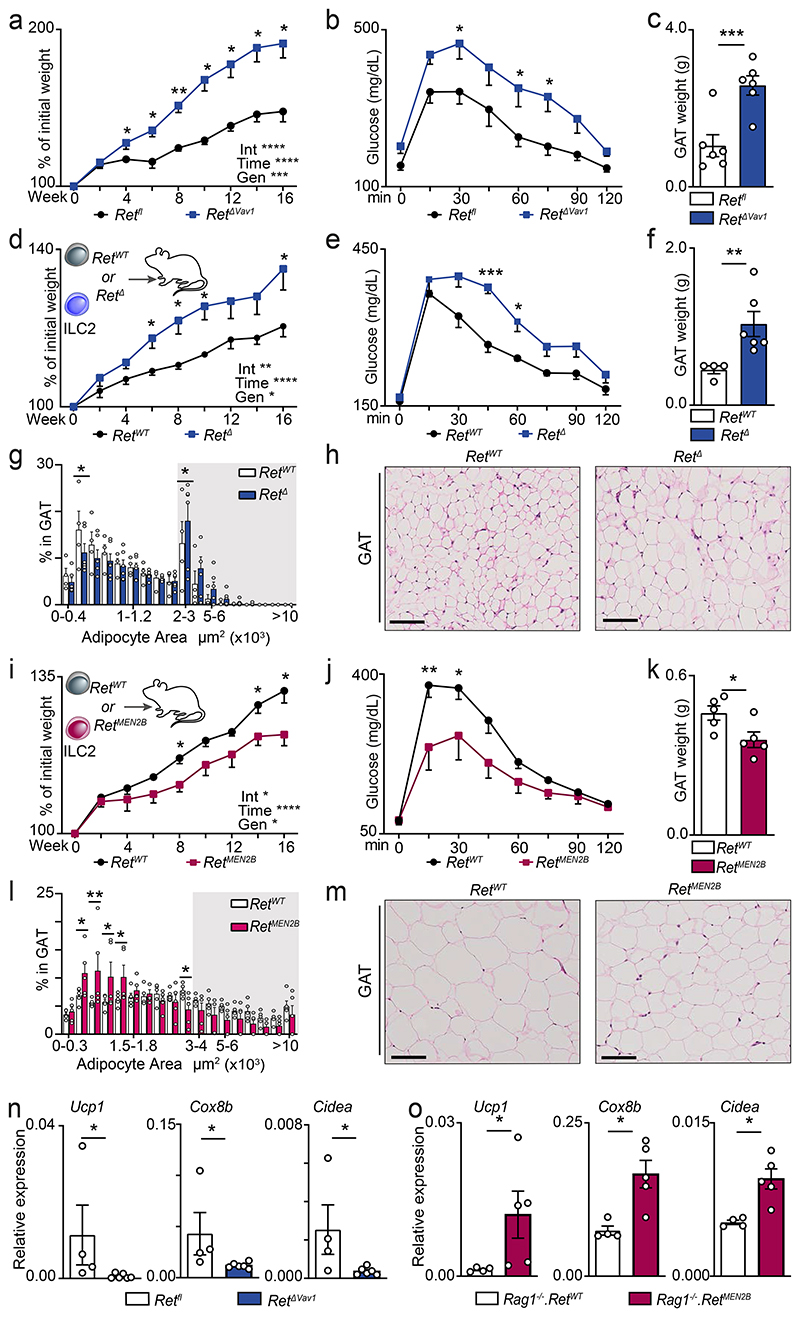
Figure 3. ILC2-intrinsic RET cues control adipose tissue physiology and obesity.
16 weeks of HFD regimen (a-m). a, Weight gain. n=6. b, Glucose tolerance test. n=6. c, GAT weight. n=6. ILC2 chimaeras: (d-h) ILC2 RetWT or RetΔ transplants; (i-m) ILC2 RetWT or RetMEN2B transplants. d, Weight gain. RetWT n=5, RetΔ n=6. e, Glucose tolerance test. RetWT n=4, RetΔ n=6. f, GAT weight. RetWT n=4, RetΔ n=6. g, Adipocyte area. Background: white 200μm2 range intervals; grey 1000μm2 range intervals. RetWT n=4, RetΔ n=6. h, GAT. Scale bar: 100μm. i, GAT weight. n=5. j, Glucose tolerance test. n=5. k, GAT weight. n=5. l, Adipocyte area. Background: white 300μm2 range intervals; grey 1000μm2 range intervals. n=5. m, GAT. Scale bar: 100μm. n, GAT. Retfl n=4, RetΔVav1 n=6. o, GAT. Rag1-/-.RetMEN2B BM chimaeras. Rag1-/-.RetWT n=4, Rag1-/-.RetMEN2B n=5. Data are representative of 3 independent experiments. n represents biologically independent animals. Data are presented as mean values and error bars: SEM. Two-sided two-way repeated measures ANOVA (a,b,d,e,i,j), corrected for multiple comparisons Benjamini, Krieger and Yekutieli procedure with tests for interaction (Int), time and genotype (Gen) reported (a,d,i), and corrected for multiple comparisons with Sidak's multiple comparisons test (b,e,j). Two-tailed unpaired Welch's t-test (c,f,k). Twotailed unpaired Student t-test, one per range interval (g,l). Two-sided Mann-Whitney test (n, o). *P<0.05; **P<0.01; ***P<0.005; ****p<0.001; ns not significant.

