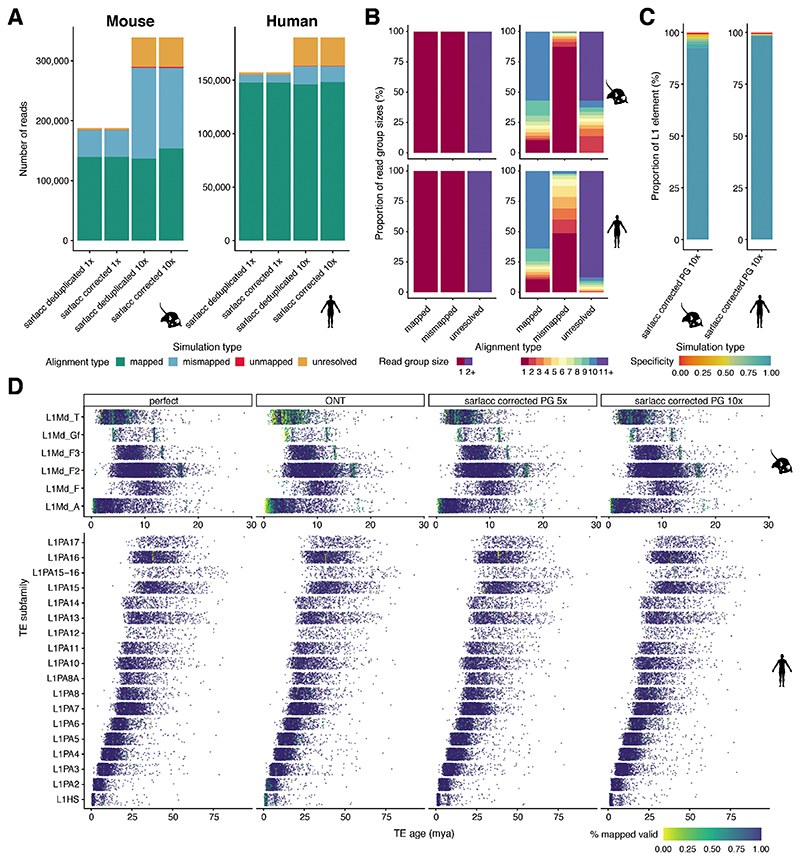
Extended Data Fig. 3. Simulation of correct mapping of young L1 in mouse and human genome.
(A) bargraph showing the number of reads (y-axis) by the simulation type with either 1x or 10x coverage (x-axis), color-coded by alignment type with mapped = read at correct location after mapping with minimap2 to the genome, mismapped = read maps at wrong location, unmapped = read not mapped, unresolved = group has more than one molecule present and group cannot be resolved to a unique read. mouse (left), human (right). (B) bargraph of proportion of read group sizes (y-axis) by alignment type (x-axis), left showing 1x read coverage, right showing 10x read coverage. Color-coded by group size. mouse (top), human (bottom). (C) Stacked bargraph showing proportion of L1 elements (y-axis) by simulation type using 10x read coverage (x-axis), coloured by specificity score, mouse (left), human (right). (D) Jitter plot of TE subfamily (y-axis) by TE age (million years ago) grouped by simulation type and coloured by % of mapped reads with yellow being 0% mapped and dark blue being 100% mapped. Mouse L1 top panel and human L1 bottom panel. Simulation type: perfect = perfect read identity, ONT = ONT read identity, ONT 5x = ONT read identity with 5x coverage, sarlacc corrected 5x = ONT read identity score, 5x coverage with sarlacc error correction, sarlacc corrected 10x = ONT read identity score, 10x coverage with sarlacc error correction, sarlacc deduplicated 5x = ONT read identity score, 5x coverage with sarlacc deduplication by randomly choosing 1 read. PG = perfect grouping.

