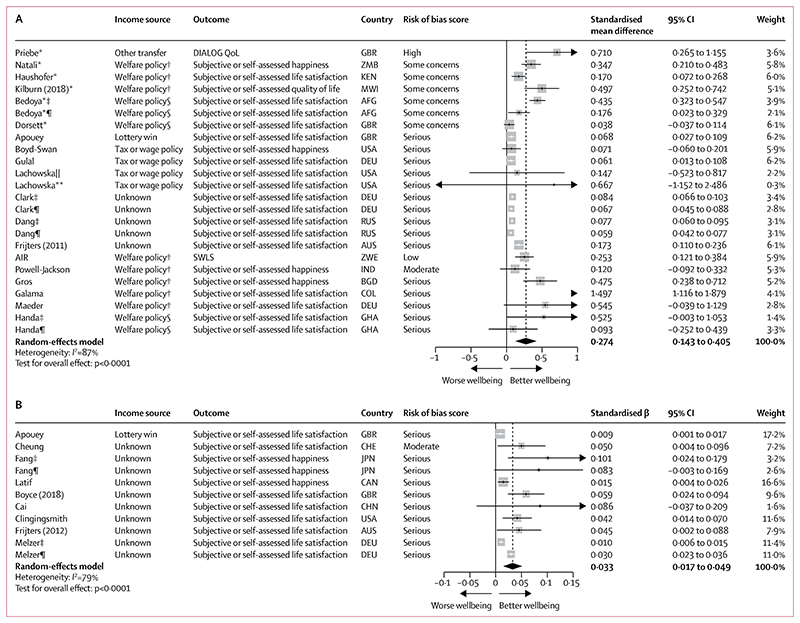
Figure 3. Forest plots for meta-analyses of studies reporting the effect of a binary income increase on a wellbeing outcome (A; n=19) and a continuous log (income) change on a wellbeing outcome (B; n=9).
In A, number of people=163 969 and number of observations=885 981. In B, number of people=105 326 and number of observations=567 356. In both panels, studies are sorted in order of trial status (randomised controlled trial or non-randomised study), income source, outcome, and risk of bias score. AFG=Afghanistan. AIR=American Institutes for Research. AUS=Australia. BGD=Bangladesh. CHE=Switzerland. CHN=China. COL=Columbia. DEU=Germany. DIALOG QoL=DIALOG quality of life scale. GBR=Great Britain. GHA=Ghana. IND=India. JPN=Japan. KEN=Kenya. MWI=Malawi. RUS=Russia. SWLS=Diener’s Satisfaction with Life Scale. ZMB=Zambia. ZWE=Zimbabwe. *Study was a randomised controlled trial. †Welfare policy only affected income. ‡Sex-stratified results for women. §Welfare policy influenced by income and other factors. ¶Sex-stratified results for men. ||Stratified results for those on medium income. **Stratified results for those on low income.

