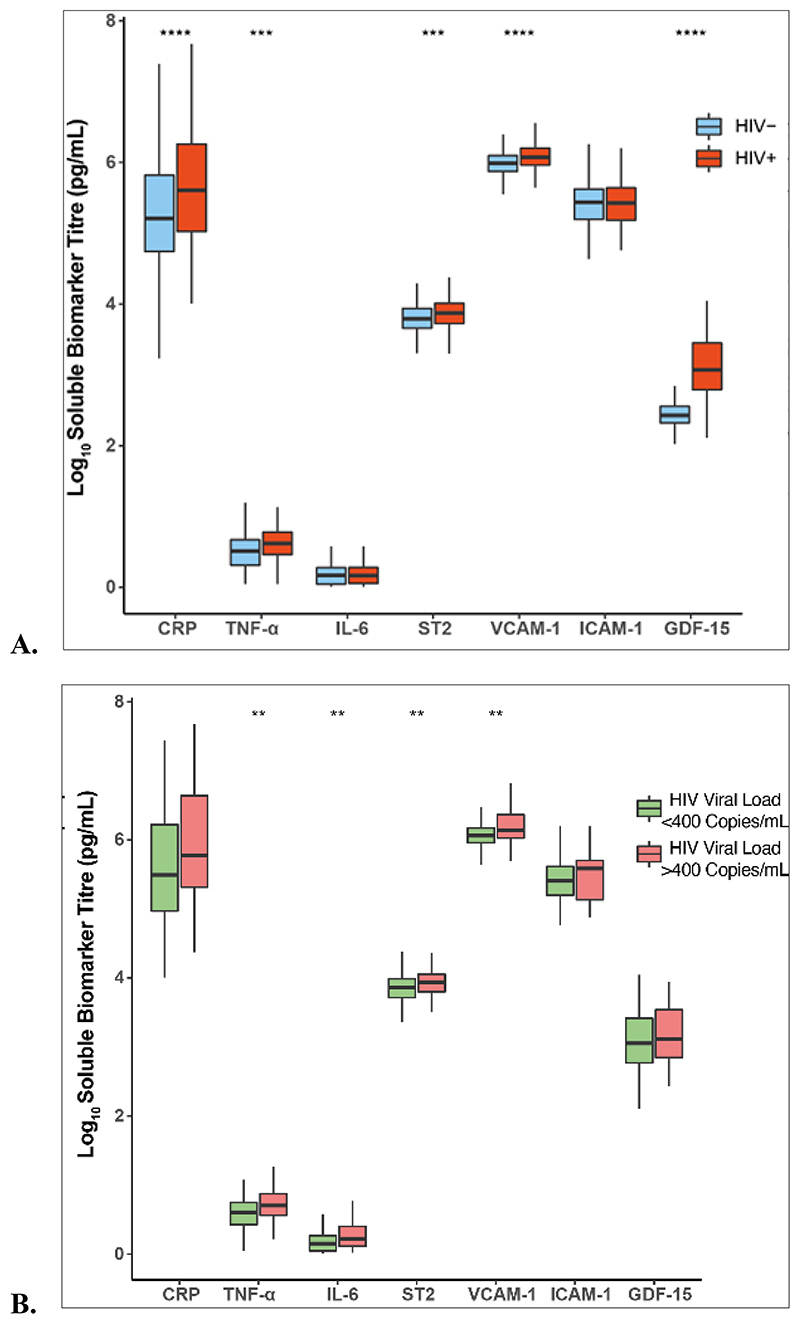
Figure 1. Comparison of biomarkers by HIV status and Viral suppression.
A) shows the comparison of log10 biomarker levels between HIV+ and HIV- groups and B) is a comparison of log10 biomarker levels by viral suppression within the HIV+ group using Wilcoxon rank sum test. Stars represent levels of significance, * 0.05, ** 0.01, ***0.001, **** 0.0001

