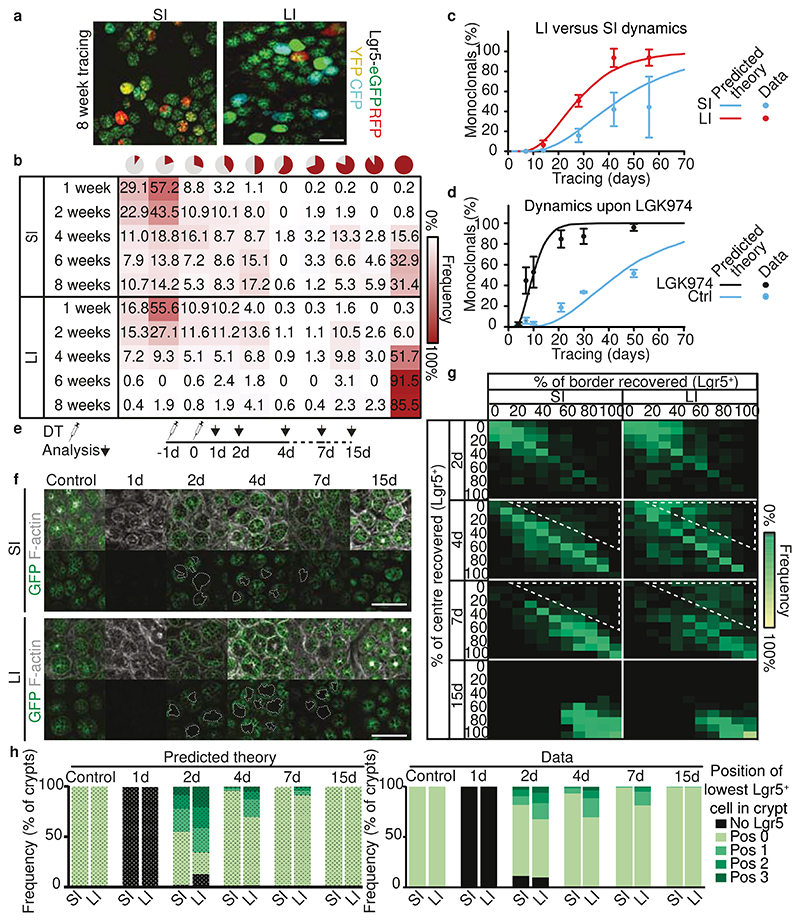
Figure 4. Consequences of retrograde movement.
a, Representative maximum projections of crypt bottoms 8 weeks after induction in SI and LI (n=5 independent experiments). b, Heat map showing frequency of clone sizes at different time points in SI and LI. c, Monoclonal crypts in SI and LI over time predicted by model (solid line) and real data in SI and LI. Dots, mean +/- SD (b,c, n= 444, 375, 218, 152, 151 clones in 3, 4, 3, 5, 7 mice (SI); n= 304, 465, 236, 164, 531 in 3, 4, 3, 5, 8 mice (LI) for 1, 2, 4, 6 and 8 weeks respectively). d, Monoclonal crypts in SI of control and LGK974 treated mice (n for control= 3, 3, 4, 4, 3, 3 mice; n for LGK974= 2, 4, 3, 5, 3, 3 mice for day 4, 7, 10, 21, 30, and 50 respectively, 200 clones per mouse) over time predicted by model (solid line) and real data reanalysed from16. Dots, mean +/- SEM. See Supplementary Note section 2.2.3 for details. e, Schematic representation. Targeted ablation of Lgr5+ cells by two DT injections in 19 Lgr5DTR:EGFP mice. f, Representative images of untreated and DT treated mice at different time points post ablation (n= 3 independent experiments). g, Heatmap of the percentage of crypts recovered in centre and border regions in the SI and LI (n= 5, 3, 4, 3 mice for day 2, 4, 7, and 15 respectively). Note the faster recovery kinetics of SI crypts (white highlighted area). h, Best numerical fit for the position of lowest Lgr5+ cell using the biophysical model (left), predicting a faster dynamics in the presence of a larger amount of retrograde movements, and experimental data (right) (n= 2, 3, 5, 3, 4, 3 mice for control, day 1, 2, 4, 7, and 15 respectively). Scale bars: 200μm (a), 100μm (f).

