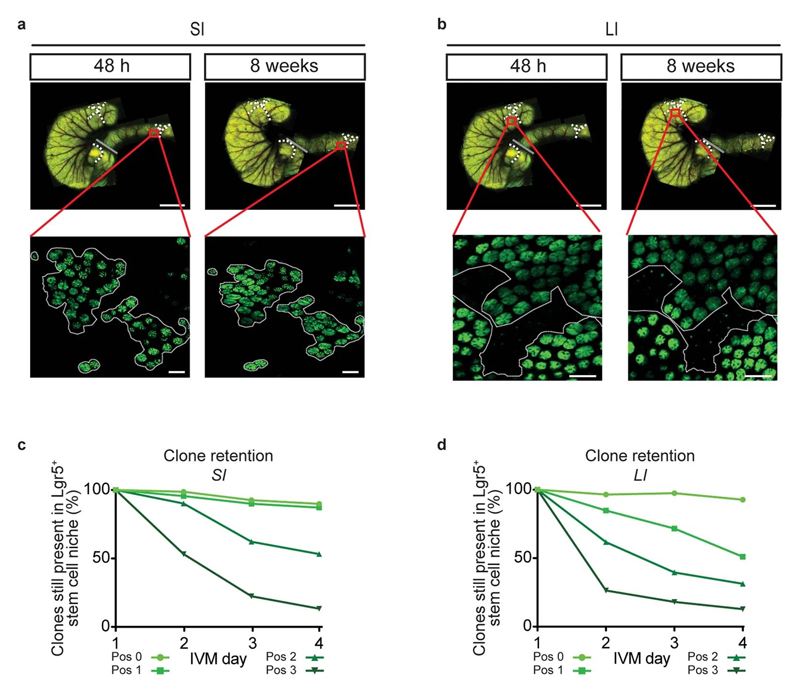
Extended Data Figure 2. Visualising effective stem cells by intravital imaging in small and large intestine. a,b, Representative.
overview images 48 hours (left) and 8 weeks (right) after tracing in Lgr5eGFP-Ires-CreERT2 mice from 6 independent experiments. Dotted lines represent same areas. Grey lines indicate SI LI boundary. Lower pictures represent intravital images showing crypt patterns (Lgr5-eGFP in green) at 48h and 8w after tracing in SI (a) and LI (b). Dotted lines are examples of retraced patchy Lgr5+ areas. Scale bar, 5 mm (top), 100 μm (bottom) from 5 independent experiments. c,d, Quantification of retention within the Lgr5+ zone of clones starting from different positions in the niche (shades of green) in SI (c) and LI (d) as followed by IVM. SI: n=305 clones in 9 mice; LI: n=311 clones in 5 mice (see Ext. Data Fig. 3-6).

