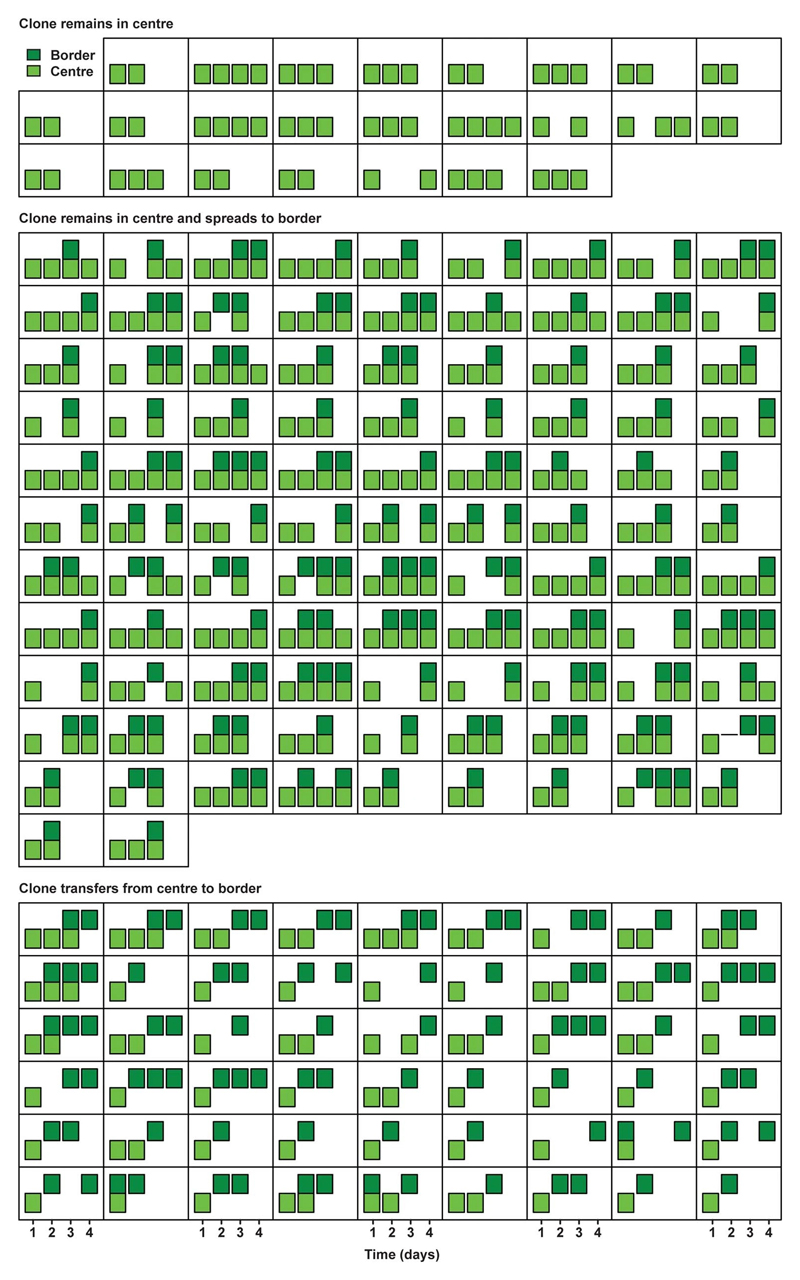
Extended Data Figure 3. Short-term evolution of clones in SI (1).
Presence in centre (light green) and border (dark green) of individual clones in Lgr5eGFP-Ires-CreERT2; R26-Confetti mice followed by short-term IVM in SI is plotted over time (squares represent individual clones, with a bar per day). Plotted are clones starting and remaining in the centre (top panel), starting and remaining in centre while spreading to border (middle panel) and starting in the centre and transferring to border (bottom panel).

