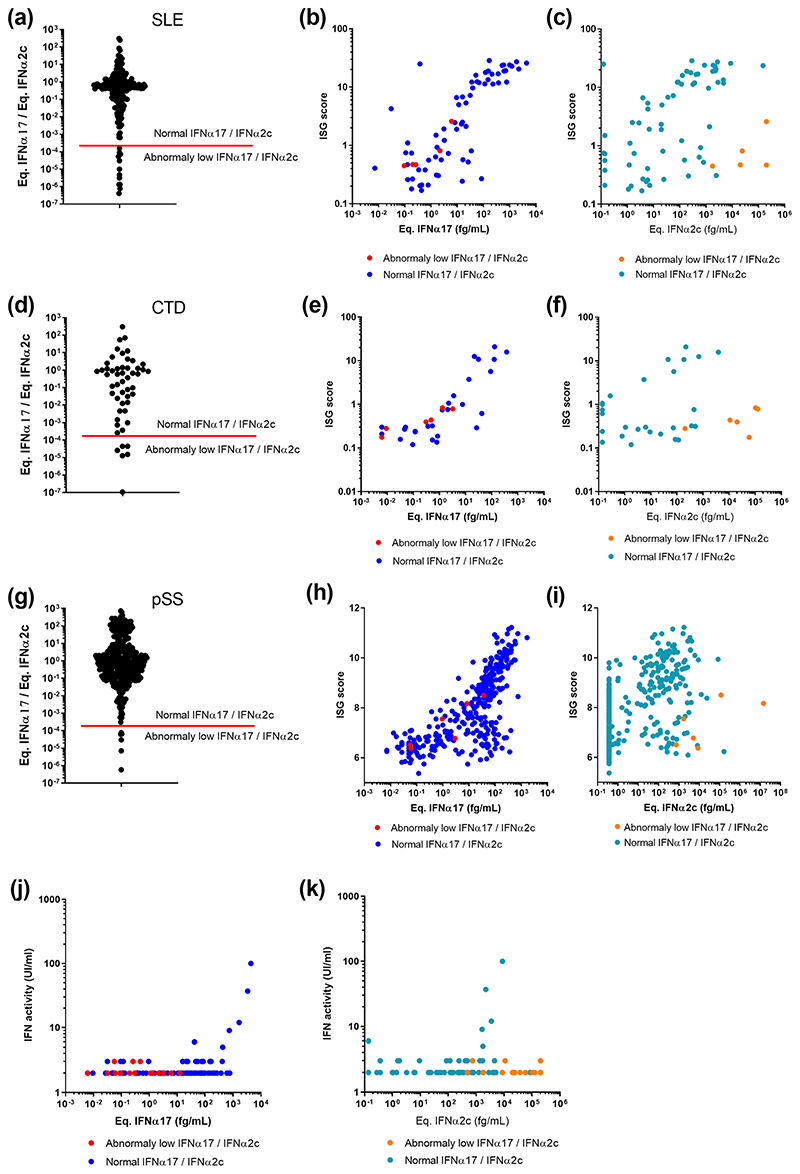
Fig. 4. Integration of IFNα17/α2 protein ratios with ISG score and functional activity.
IFNα17/α2 protein ratios obtained from samples of patients with (a) SLE, (d) CTD and (g) pSS. The red bar indicates the lower IFNα17/α2 protein ratio using pure molecules. Correlation of ISG score with pan-IFNα assay (b, e, h) or IFNα2 assay results (c, f, i) for same patients. Correlation of IFN functional activity with pan-IFNα assay (j) or IFNα2 assay results (k) for same patients. Patients with an IFNα17/α2 protein ratio threshold above the 2 · 10-4 cut off are in blue, those below in red.

