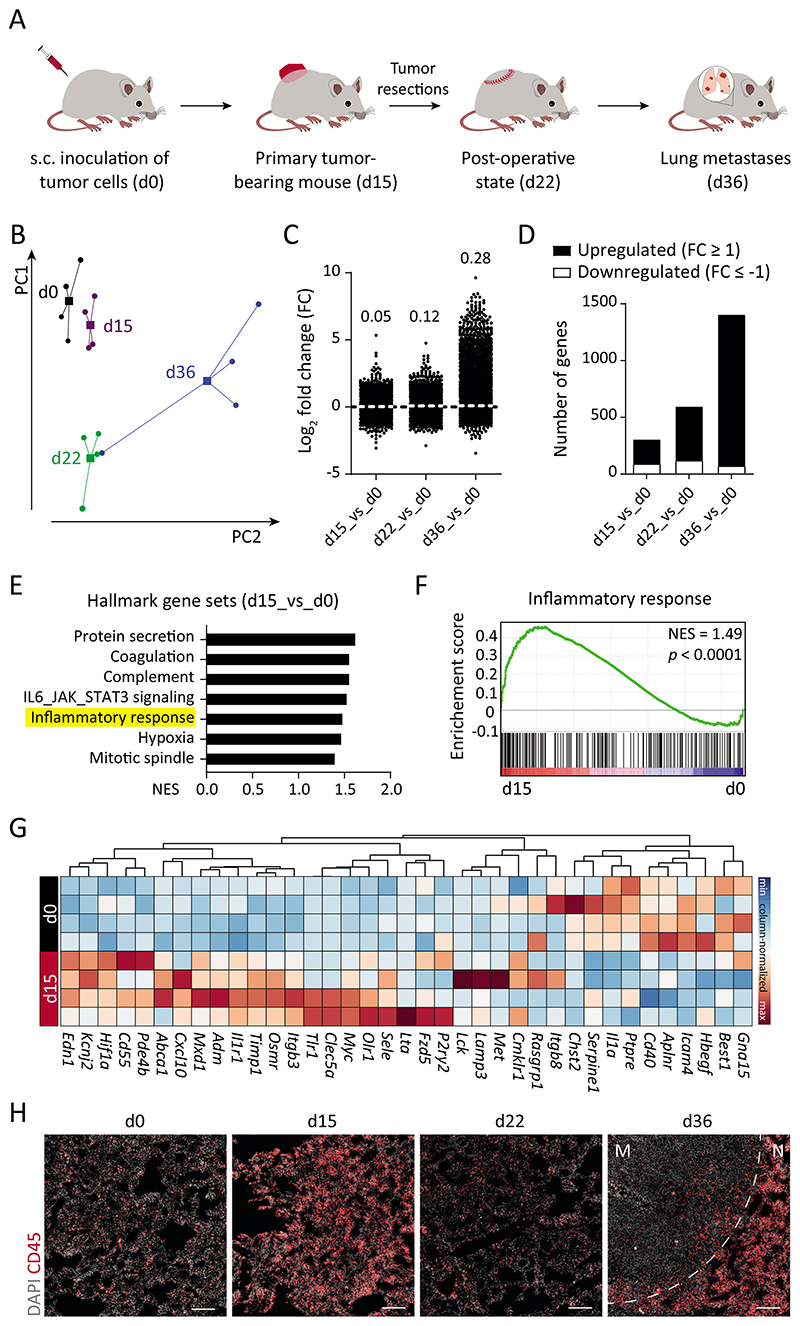
Fig. 1. Transcriptomic evolution of lung ECs during metastasis.
(A) Schematic depiction of the LLC spontaneous metastasis model, in which C57BL/6N mice develop lung metastases around 3 weeks after primary tumor resection. (B) Principal component analysis of RNA-seq data of isolated lung ECs (n = 4 samples for each time point). Circles denote individual samples and squares denote the centroid of each group. (C) Dot plot showing Log2-fold change (FC) for genes with reads per kilobase of transcript, per million mapped reads (RPKM) ≥ 1 in at least one of the samples. The mean FC of all analyzed genes is indicated for each comparison. (D) Bar graph illustrating the number of significantly upregulated (↑) and downregulated (↓) genes in d15 (226 ↑, 89 ↓), d22 (480 ↑, 119 ↓), and d36 (1329 ↑, 71 ↓) lung ECs as compared with d0. (E) Gene Set Enrichment Analysis (GSEA) comparing d15 and d0 data sets. (F) The inflammatory response gene set was found to be positively correlated with d15 time point. (G) Heatmap highlighting genes in the inflammatory response gene set. (H) Immunofluorescence images showing infiltrating CD45+ immune cells in the lung tissue. Scale bars = 200 μm. M = metastatic nodule; N = normal adjacent tissue; NES = normalized enrichment score.

