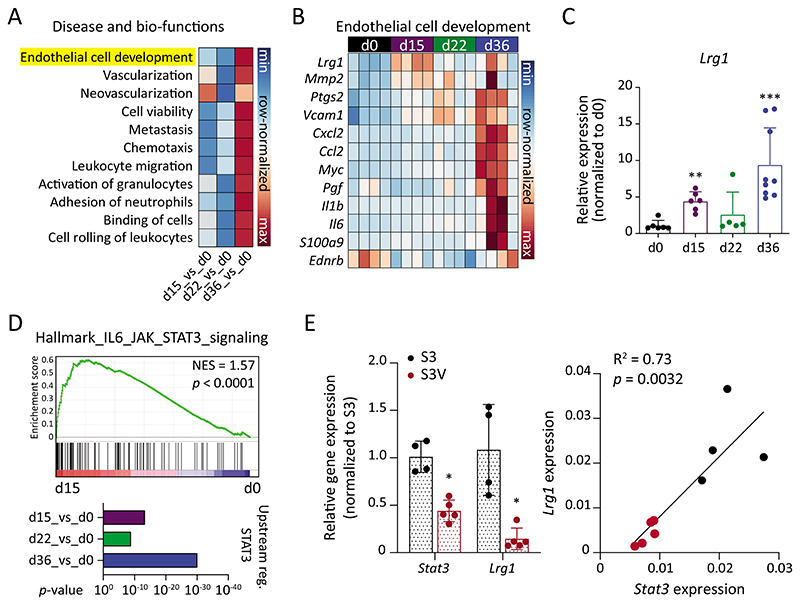
Fig. 2. Lrg1 expression closely reflects tumor progression.
(A) Comparison of disease and bio-functions was conducted using Ingenuity Pathway Analysis (IPA). Correlation scores (z-scores) are shown for the selected disease and bio-functions. (B) Genes involved in the EC development gene set are shown in row-normalized Log2-expression values. (C) qPCR quantitation of Lrg1 expression in lung ECs to validate RNA-seq data (mean ± SD, n = 5-9 mice). **, P<0.01; ***, P<0.001 (two-tailed Mann-Whitney U test, comparing to d0). (D) GSEA plot comparing IL6_JAK_STAT3 signaling between d15 and d0 (upper panel). IPA analysis to compare STAT3 as an upstream regulator during metastatic progression. (E) On the left, qPCR analysis of Stat3 and Lrg1 expression in lung ECs isolated from tumor-bearing Stat3fl/fl (S3) or Stat3fl/fl X VECadCreERT2 (S3V) mice (mean ± SD, n = 4-5 mice). *, P<0.05 (two-tailed Mann-Whitney U test, comparing to S3). On the right, Pearson’s correlation between Stat3 and Lrg1 expression.

