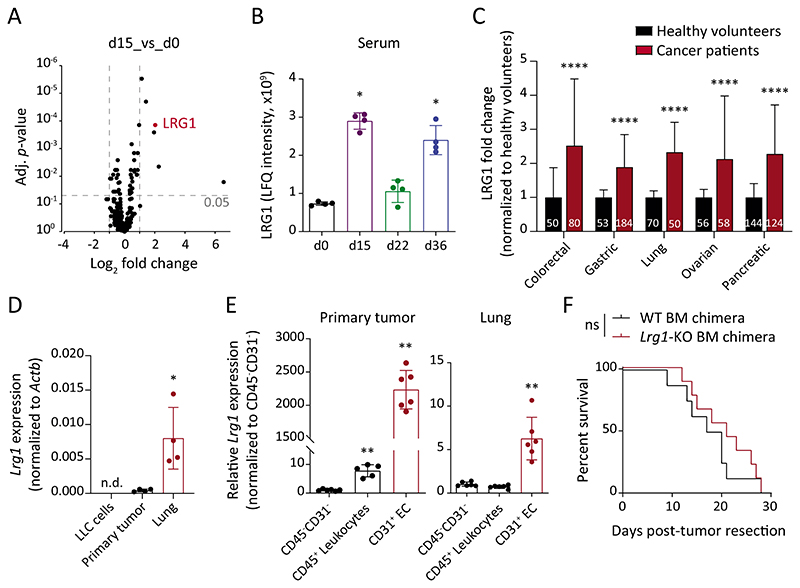
Fig. 3. LRG1 is systemically elevated during tumor progression.
(A) Volcano plot displaying FC and adjusted P-value for each identified protein in LC-MS analyses. The mean of 4 biological replicates is indicated. (B) Shown are LFQ intensities of LRG1 protein in serum samples (mean ± SD, n = 4 mice). *, P<0.05 (two-tailed Mann-Whitney U test, comparing to d0). (C) LRG1 protein amounts in sera of cancer patients and healthy volunteers were retrieved from previously published articles (25–29). The bar graph shows relative LRG1 abundance normalized to the corresponding healthy cohort. Data normalization removes differences originating due to varying measurement techniques employed in different studies. The size of each sample cohort is indicated in the graph. ****, P<0.0001 (multiple t-tests corrected with the Holm-Sidak method). (D) Comparison of Lrg1 expression between in vitro-cultured LLC cells, primary tumor and d15 lung tissue (mean ± SD, n = 4 mice). *, P<0.05 (two-tailed Mann-Whitney U test, comparing to primary tumor). (E) ECs, leukocytes, and CD31-CD45- cells were isolated from primary tumors and d15 lung tissues. Dot plots show relative Lrg1 expression in ECs and leukocytes as compared with CD31-CD45- cells (mean ± SD, n = 5-6 mice). **, P<0.01 (two-tailed Mann-Whitney U test, comparing to corresponding CD31-CD45- cells). (F) LLC tumors were implanted in WT or Lrg1-KO BM chimeras. Kaplan-Meier graph showing overall survival of mice after primary tumor resection (n = 8-9 mice). The comparison was rendered non-significant (ns) according to Log-rank (Mantel-Cox) test. n.d. = non-detectable.

