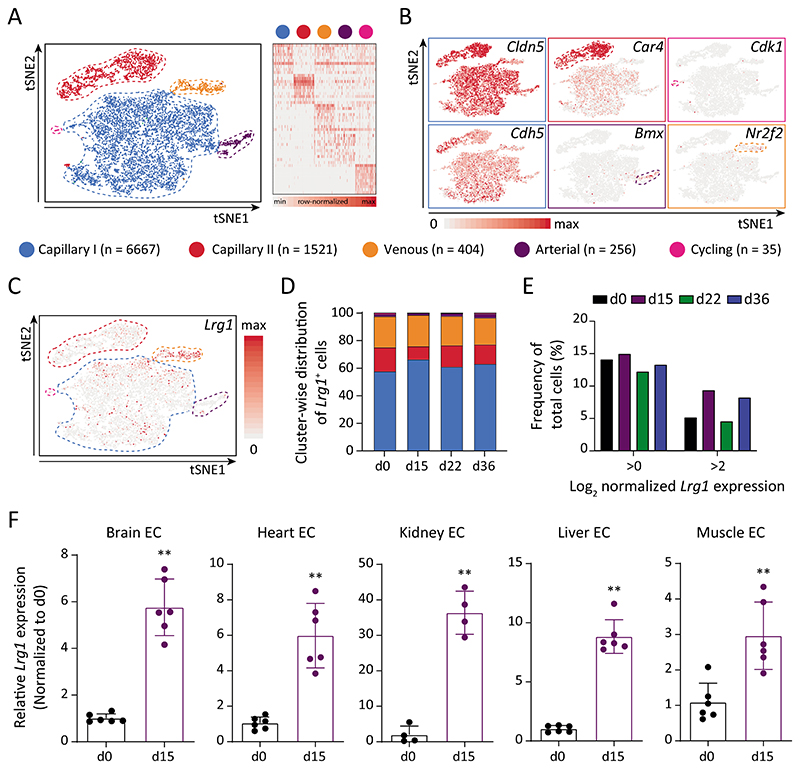
Fig. 4. Multi-organ vascular endothelial cells upregulate Lrg1 expression and serve as a signal amplifier.
(A) On the left, tSNE visualization of color-coded clusters of lung ECs (n = 8,883 cells). On the right, gene signature of the capillary I/II, arterial, venous, and cycling subpopulations based on 10 most-upregulated genes. (B) Feature plots indicating enriched genes for each identified subpopulation. EC-specific Cldn5 and Cdh5 were uniformly expressed by all subpopulations. (C) Feature plot displaying Lrg1 expression across all analyzed lung EC. (D) Shown is the cluster-wise spread of Lrg1-expressing cells for each sample. (E) The graph highlights the frequency of Lrg1-expressing cells (Log2-normalized expression >0 or >2) amongst the total number of cells per sample. (F) Lrg1 expression was analyzed in ECs isolated from multiple organs of d0 and d15 mice (mean ± SD, n = 4-6 mice). **, P<0.01 (two-tailed Mann-Whitney U test, comparing to d0).

