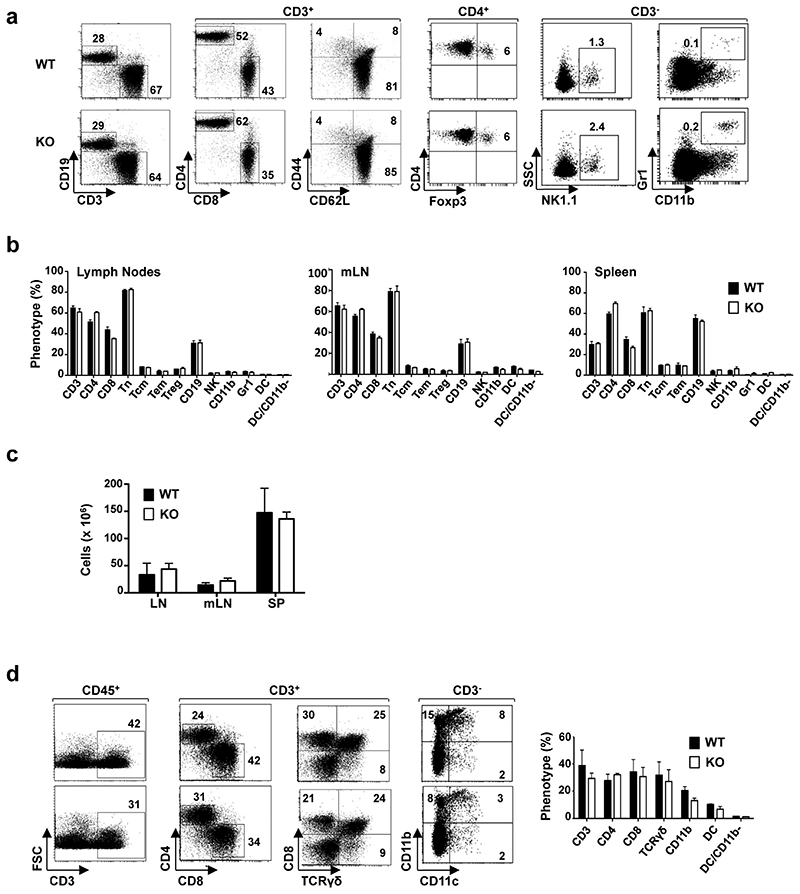
Extended Data Figure 4. Immune cell homeostasis is not altered in Pou2f3−/− tuft-cell-deficient mice.
a, The repartition of immune cells in wild-type and Pou2f3−/− mice was monitored by flow cytometry. The presence of T (CD3+), B (CD19+), CD4+, CD8+, naive (Tn; CD3+ CD62L+CD44-), central memory (Tcm; CD3+CD62L+CD44+), effector memory (Tem; CD3+CD62L-CD44+), regulatory (Treg; CD4+Foxp3+), natural killer (NK; CD3-NK1.1+) and myeloid (CD11b+Gr1+) cells was assessed by staining with fluorochrome-tagged antibodies and representative dot plots are shown. The percentages of positively-stained cells are indicated. b, Quantification of the different immune cells in lymph nodes (LN), mesenteric lymph nodes (mLN) and spleens (SP) of wild-type and Pou2f3−/− mice are presented. Data are means ± s.d. (n = 3 mice per genotype). c, Total cells in LN, mLN and SP of wild-type and Pou2f3−/− mice are presented as means ± s.d. (n = 3 mice per genotype). d, Immune lineage cells in the lamina propria of wild-type and Pou2f3−/− mice were monitored by flow cytometry after tissue dissociation. The percentage of T cells was assessed within the CD45+ haematopoietic gate, CD4, CD8 and gamma-delta T cells (CD8+TCR-γδ+) within the CD3+ gate and myeloid cells within the CD3- gate, as indicated. Representative dot plots are presented (left). Quantification of immune cells within the lamina propria are shown as means ± s.d. (n = 3 mice per group). No significant differences were detected for all cell types between wild-type and Pou2f3−/− mice (P > 0.05). A two-tailed Student’s t-test was used.

