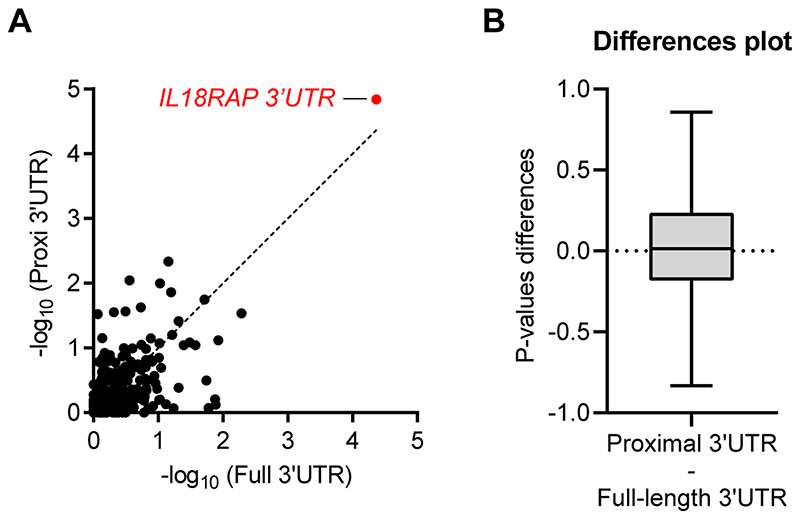
Extended Data Fig. 4. Restricting rare-variant association analysis to the proximal part of 3′UTRs does not improve the association signal.
(a) Scatter plot with SKAT-O P-values (log scale) calculated for region-based rare-variant association analysis of the full 3′UTRs on the x-axis versus the 3′UTRs proximal quadrant on the y-axis, for the 295 3′UTRs listed in Supplementary Table 3, in the Project MinE cohort (3,955 ALS cases and 1,819 non-ALS controls) (Pearson correlation coefficient (r=0.61) and P-value ****< 0.0001). The 45-degree diagonal line represents a perfect correlation of r=1. IL18RAP 3′UTR (red). (b) A Difference plot showing the difference between the two P-value measurements (3′UTRs proximal quadrant minus the full 3′UTRs, for the cohort of N=295 3′UTRs). The bias (difference between means) is only 0.03. Overall the P-values gained from the 3′UTRs proximal quadrant were comparable to that of the full 3′UTRs in the cohort of 295 3′UTRs. For box plot, the median is indicated by the central line, upper and lower quartiles are indicated by the box, and maximum/minimum values are indicated by the whiskers (Wilcoxon matched-pairs P-value > 0.05, Cohen’s d effect size = 0.1). Hence, the apparent spatial distribution of variants in IL18RAP 3′UTR seems to be a particular case, rather than part of a global pattern.

