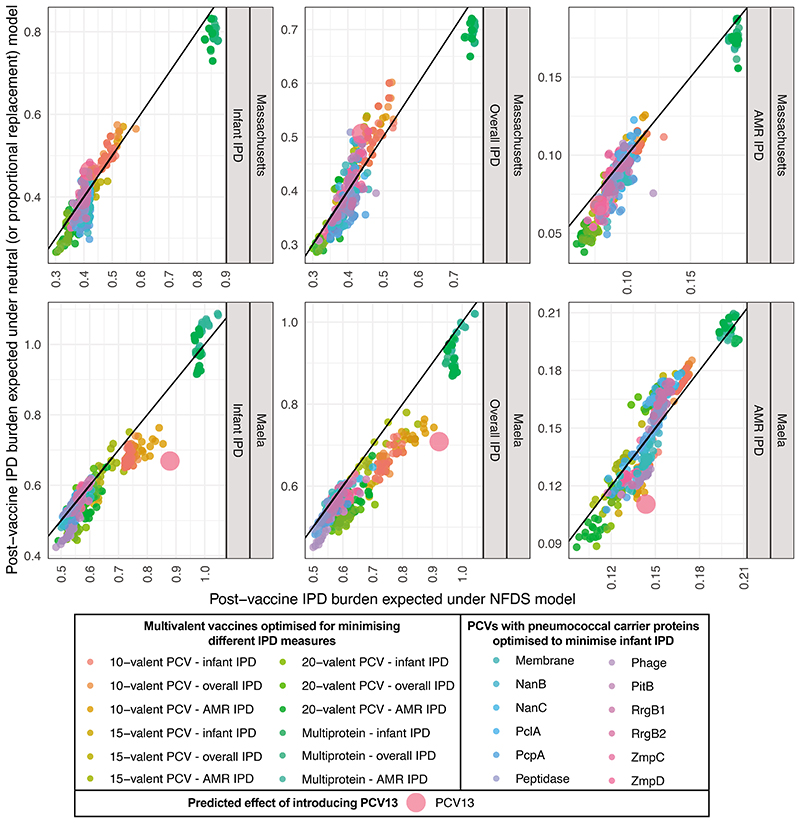
Extended Data Figure. 10. Comparing formulations’ effects on IPD using different ecological models.
These scatterplots compare the simulated effectiveness of vaccine formulations in the original multi-locus NFDS model and an otherwise equivalent ‘proportional replacement’ neutral model (Extended Data 2). Each plot shows the expected post-vaccine IPD burden expected under NFDS and neutral evolution. Points (n = 480 for the Massachusetts population; n = 440 for the Maela population) are coloured by optimisation constraint and criterion, and the line of identity is marked. The results are very similar under each ecological model, with vaccine compositions that we predict to perform better than PCV13 also tending to do so in the neutral model. This indicates the formulations we have identified perform well despite the predicted effects of NFDS, rather than because of them.

