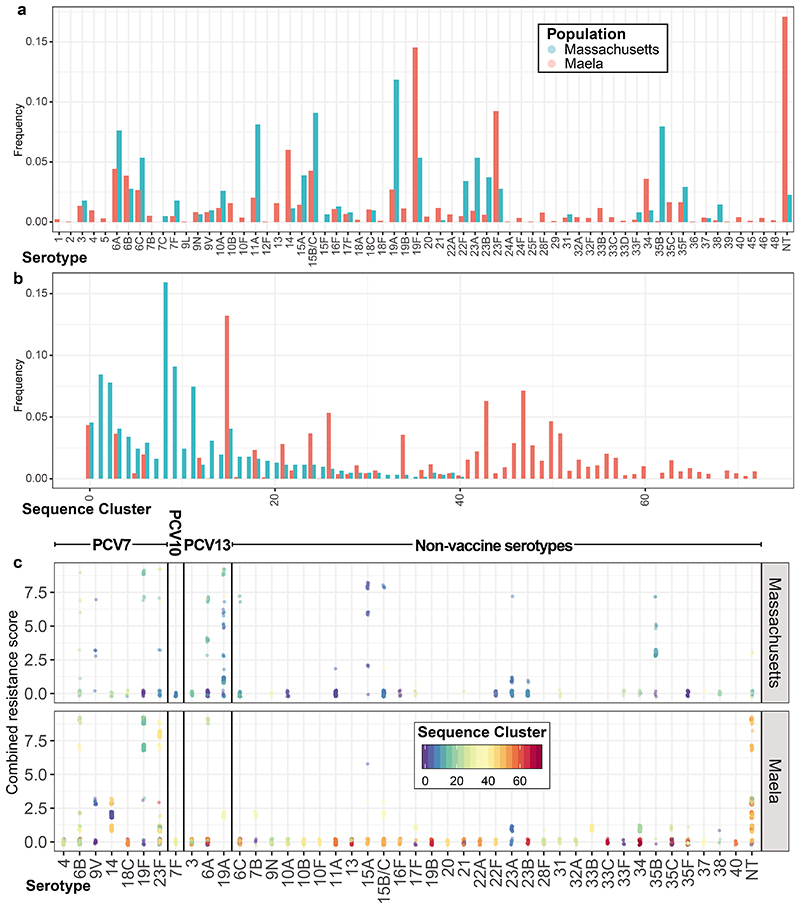
Extended Data Figure. 1. Comparison of the Massachusetts and Maela S. pneumoniae populations.
Comparison of the Massachusetts and Maela populations. a, Frequencies of serotypes across the two studied populations; serotypes 15B and 15C, which rapidly interchange but were resolved separately in the Maela dataset, are merged into 15B/C for comparability in this plot. b, Frequencies of sequence clusters, groupings analogous to strains defined by Corander et al, across the two populations. Both plots demonstrate the dissimilarity of these two S. pneumoniae populations, despite them being isolated from nasopharyngeal carriage almost contemporaneously. c, Distribution of resistance scores relative to the population structure within each serotype across the Massachusetts and Maela populations. Each colour represents a different sequence cluster, such that they can be distinguished within a serotype.

