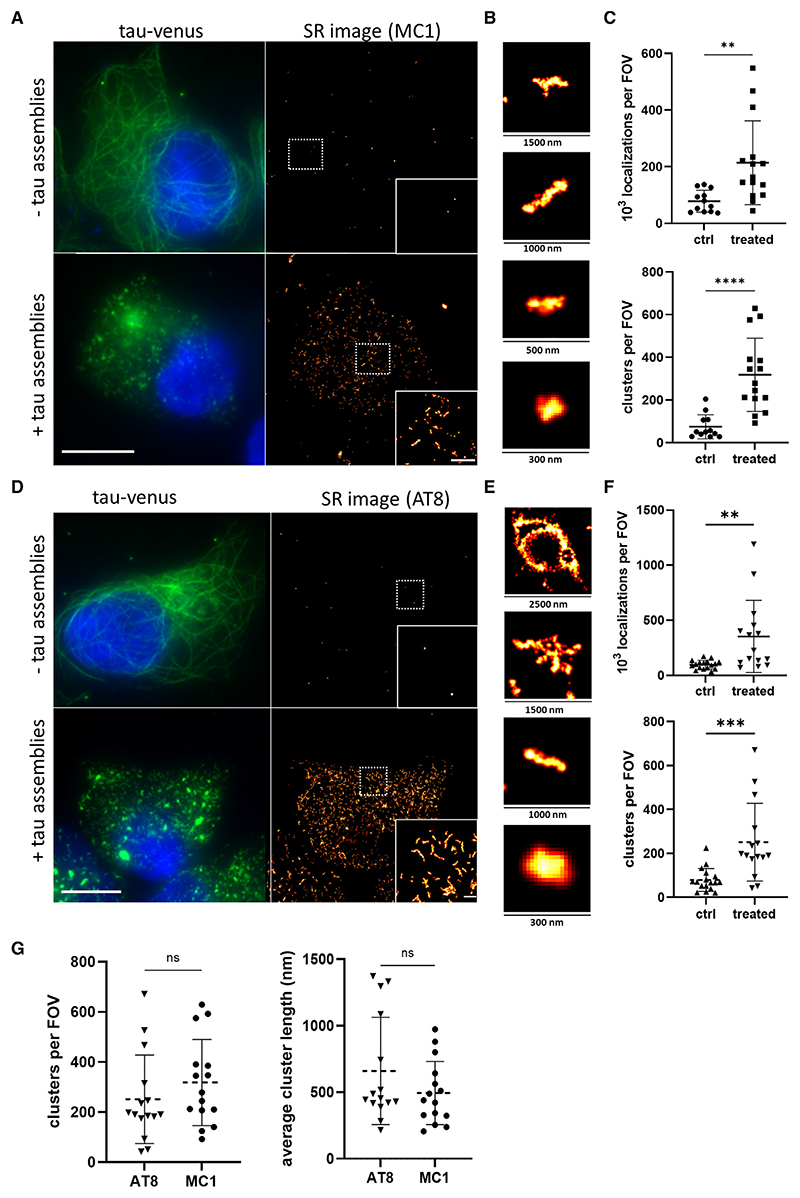
Figure 1. SR imaging of tau aggregates in HEK293 cells.
(A) Diffraction-limited (left) and SR (right) images of HEK293 cells stably expressing P301S tau-Venus with and without 100 nM recombinant P301S tau fibrils treatment for 24 h. Fixed cells were imaged using Venus fluorescence (green) for the imaging of total tau, while tau aggregates were visualized by STORM using the MC1 antibody (hot-red). Scale bars, 10 μm (left) and 2 μm (right).
(B) Examples of individual tau aggregates of different sizes.
(C) Cells treated with tau assemblies were compared to control cells for the number of detected localizations and the number of detected tau assemblies.
(D) Diffraction-limited (left) and SR (right) images of HEK293 cells expressing P301S tau-Venus with and without 100 nM recombinant P301S tau fibrils treatment for 24 h. Fixed cells were imaged using Venus fluorescence (green) for the imaging of total tau, while tau aggregates were visualized by STORM microscopy using the AT8 antibody (hot-red). Scale bars, 10 μm (left) and 2 μm (right).
(E) Examples of individual tau aggregates of different sizes.
(F) Cells treated with tau assemblies were compared to control cells for the number of detected localizations and the number of detected tau assemblies.
(G) Comparison of the number of detected tau assemblies (derived from C and F) and their length as detected by the MC1 and the AT8 antibody. The plotted data represent mean values ±SD. An unpaired t test was used for statistical analysis (n.s., not significant; **p < 0.01, ***p < 0.001, ****p < 0.0001) (n > 15 cells per condition were imaged from three biological replicates). See also Figures S1-S3.

