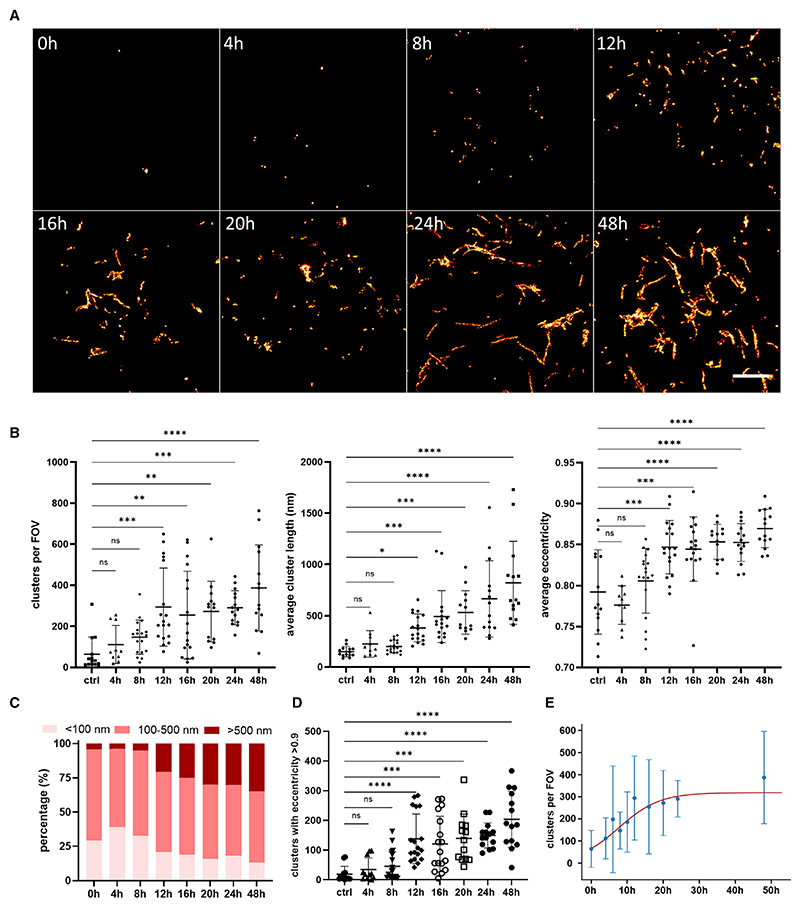
Figure 2. SR images reveal time-dependent replication of endogenous tau assemblies after treatment with tau assemblies.
(A) HEK293 cells expressing untagged P301S tau were treated with 100 nM recombinant P301S tau fibrils. At defined time points, cells were fixed and immunostained with the AT8 antibody for dSTORM imaging. Representative SR images of a zoomed area in a cell are displayed. Scale bar, 3 μm.
(B) The number of assemblies detected per FOV, as well as their length and average eccentricity, were analyzed and plotted.
(C) The percentage of aggregates with length less than 100 nm or more than 500 nm was quantified.
(D) The number of tau assemblies with an eccentricity higher than 0.9 was plotted.
(E) Kineticanalysisoftheformation ofintracellularaggregates. Dataare shown as meanvalues(±SD) from (B), but all data points are used inthe fitting toaminimal model of replication. The statistical analysiswas based on a one-wayANOVAtest combined with Tukey’s post hoctest (n.s., not significant; *p < 0.05, **p < 0.01, ***p < 0.001, ****p < 0.0001) (n > 10 cells per condition were imaged from three biological replicates).
See also Figures S3 and S4; Table S1.

