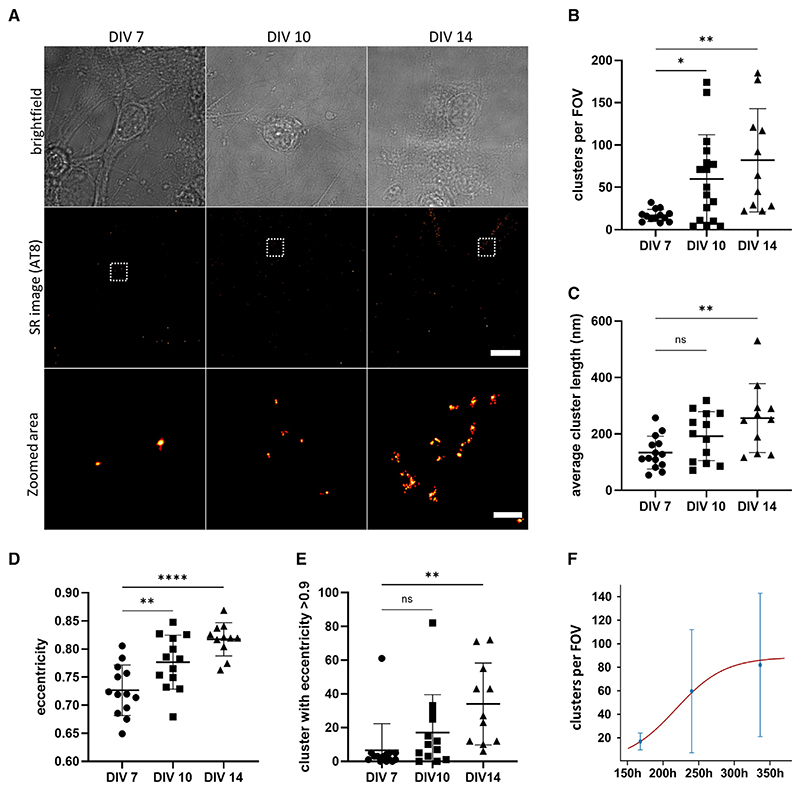
Figure 4. Small tau assemblies are formed spontaneously in primary cultures derived from P301S tau transgenic mice.
(A) Untreated DIV 7, 10, and 14 primary cultures derived from P301S tau transgenic mice were fixed and immunostained with the AT8 antibody for dSTORM imaging. Scale bars, 10 μm (top) and 2 μm (bottom).
(B–D) The number of assemblies detected per FOV (B), their length (C), and their eccentricity (D) were analyzed and plotted.
(E) The number of assemblies with eccentricity higher than 0.9 were quantified.
(F) Kinetic analysis of the spontaneous formation of intracellular aggregates over time; data are shown as mean values (±SD) from (B), but all data points are used in the fitting to a minimal model of replication. The statistical analysis was based on a one-way ANOVA test combined with Tukey’s post hoc test (n.s., not significant; *p < 0.05, **p < 0.01, ****p < 0.0001) (n > 11 FOVs per condition were imaged from three biological replicates).
See also Table S1.

