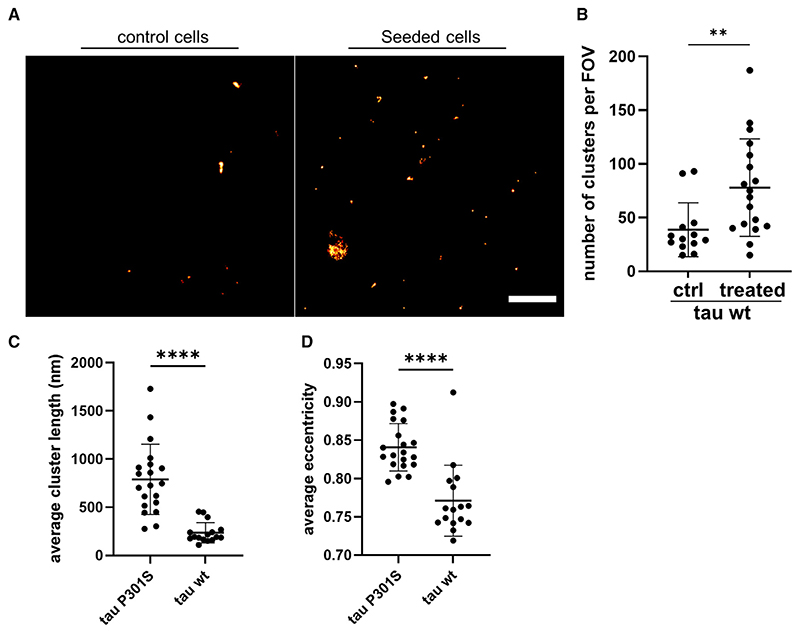
Figure 5. Templated seeding characteristics of WT tau in cells.
(A) HEK293 cells expressing untagged WT tau were imaged by dSTORM after treatment with 100 nM recombinant P301S tau fibrils for 24 h and subsequent immunolabeling with the AT8 antibody. Scale bar, 3 μm.
(B) The number of formed assemblies were compared to mock-treated cells.
(C and D) The average length of the formed clusters (C) as well as their eccentricity (D) were compared to cells expressing P301S tau after being treated under the same conditions. The plotted data represent mean values ±SD. The statistical analysis in (B), (C) and (D) was based on an unpaired t test (**p < 0.01, ****p < 0.0001) (n ≥ 13 cells per condition were imaged from three biological replicates).

