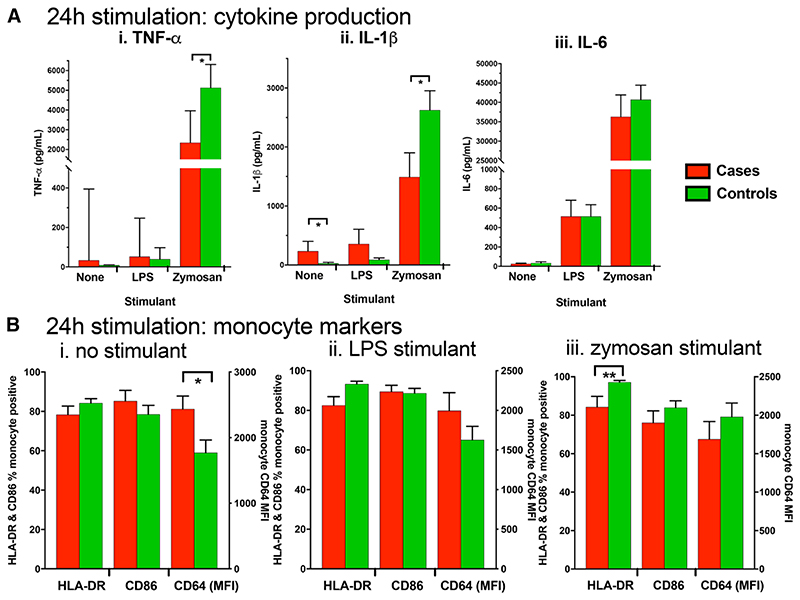
Figure 4.
A, Whole blood cytokine production following 24-hour stimulation. B, Percentage of total monocytes (CD66a/c/ e–) expressing surface markers following whole blood culture with (i) no stimulation, (ii) 0.5 EU/mL of LPS or (iii) 0.5 μg/mL of zymosan. Comparisons were made by Mann-Whitney U test; * = P<0.05.

