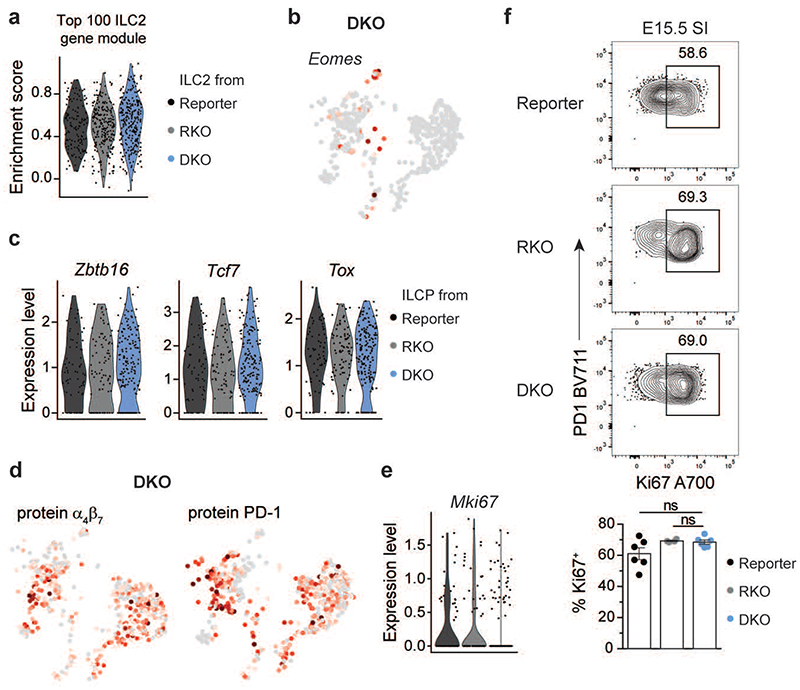
Extended Data Fig. 5. Comparative gene expression of ILCP from reporter, RKO and DKO mice.
a, Violin plots for enrichment score of gene modules of top 100 differentially expressed genes from reporter ILC2 within ILC2 cluster in indicated mouse strains. Statistical significance was calculated using two-sided Wilcoxon test with Bonferroni correction, all ns. (b) Eomes expression in DKO mice projected on UMAP. (c) Expression of selected ILCP-associated genes in cells from ILCP cluster in indicated mouse strains. (d) Expression of selected proteins on UMAP projection analysed by CITE-Seq. (e) Violin plot for Mki67 transcripts among ILCP in all mouse strains, legend see in (c). (f) Representative flow cytometry of Ki67 expression in LinLD- CD45+CD127+ROR□t-PD1hiPLZFhi cells from E15.5 SI (reporter n=6, RKO n=4, DKO n=6 from 2 independent experiments). Quantification as mean ± SEM with Kruskal-Wallis significance and Dunn’s correction. Detailed statistics are available in source data.

