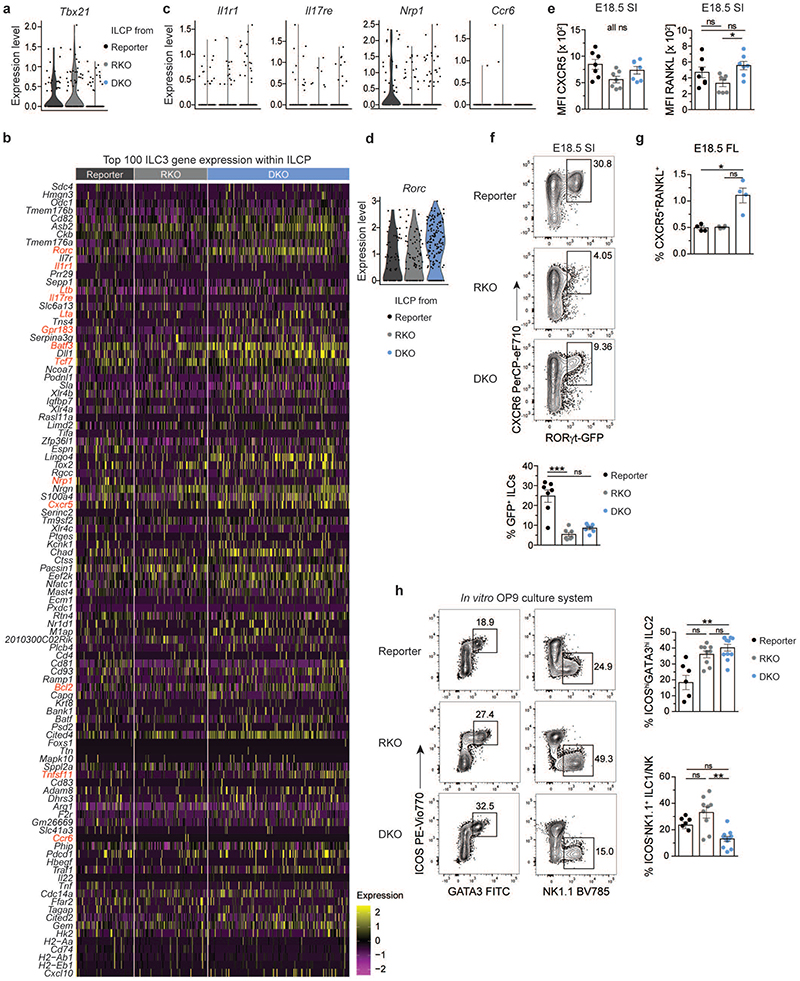
Extended Data Fig. 6. Gene and protein expression patterns in ILCP of reporter, RKO and DKO mouse strains.
a, Expression levels of Tbx21 within ILCP of all strains. (b) Gene expression profiles of the top 100 genes differentially expressed in ILC3 of reporter mice within cells from ILCP cluster in the different mouse strains. (c) Violin plots depicting expression of selected transcripts in ILCP of the three mouse strains, legend see in (A). (d) Violin plot depicting Rorc expression within ILCP of indicated mouse strains. (e) Geometric mean fluorescence intensity of CXCR5 and RANKL within LinLD-CD45+CD127+ and/or CD122+ cells isolated from E18.5 SI (n=7 from 2 independent experiments) depicted as mean ± SEM and Kruskal-Wallis significance with Dunn’s correction. Data from two independent experiments. (f) Representative flow cytometry from E18.5 SI of LinLD-CD45+ CD127+ and/or CD122+ cells and quantification as mean ± SEM of GFP+ cells (n=7 from 2 independent experiments) with Kruskal-Wallis significance and Dunn’s correction. (g) Frequencies of CXCR5+RANKL+ cells among LinLD-CD45+CD127+ and/or CD122+ cells in fetal liver (FL) of E18.5 embryos (n=4 from 2 independent experiments) with Kruskal-Wallis significance and Dunn’s correction. (h) in vitro differentiation of E14.5 fetal liver-derived ILC progenitors on OP9 stromal cells for 5-8 days in the presence of SCF and IL-7 and analysis by flow cytometry. Quantification of LinLD-CD45+ICOShiGATA3hi ILC2 and LinLD-CD45+ICOS-NK1.1+ group 1 ILCs cells in the different mouse strains shown as mean ± SEM. Data are representative of 2-3 independent experiments (reporter n=5 from 2 independent experiments, RKO n=9 and DKO n=11 from 3 independent experiments). Kruskal-Wallis significance and Dunn’s correction. Detailed statistics are available in source data.

