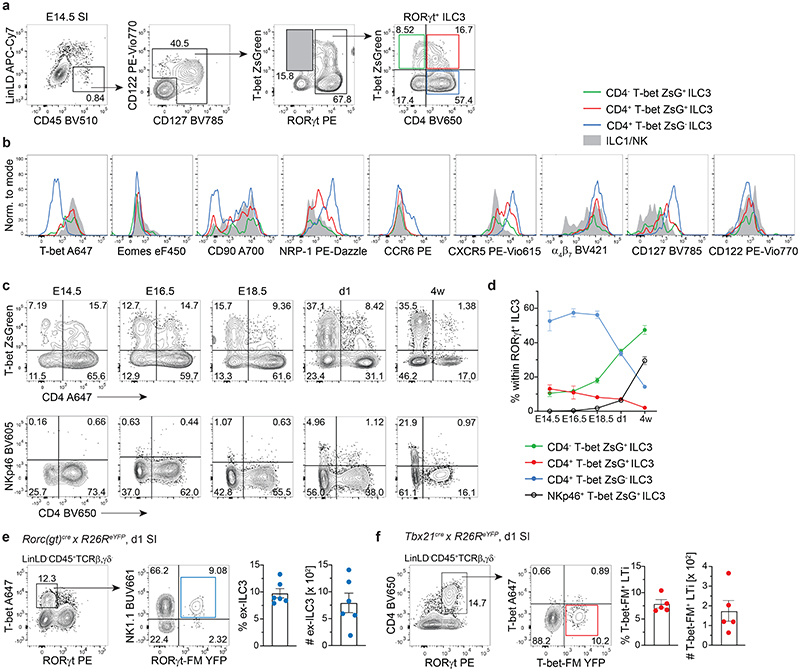
Fig. 3. A subset of RORγt+T-bet+CD4+ ILC3 emerges during embryonic development.
(a-d) Flow cytometric analysis of embryonic T-bet ZsGreen reporter mice. a, Representative gating of E14.5 small intestine (SI) for identification of T-bet+RORγt- ILC1 (grey shaded gate) and RORγt+ ILC3 subsets based on expression of CD4 and T-bet ZsGreen. (b) Representative histograms of marker expression by ILC1/NK or ILC3 subsets from E14.5 SI. (c) Representative plots of T-bet ZsGreen or NKp46 and CD4 expression by RORγt+ ILC3 isolated from SI at different indicated embryonic and postnatal time-points. (d) Quantification of frequency of designated RORγt+ ILC3 subsets over time in ontogeny. Graphs depict data as mean ± SEM, E14.5 n=4 (pooled samples) examined over 4 independent experiments, E16.5 n=2 (pooled samples) examined over 2 independent experiments, E18.5 n=10 (individual samples) examined over 3 independent experiments, d1 n=8 (individual samples) examined over 2 independent experiments, 4 w n=7 examined over 2 independent experiments. (e) Representative SI gating on T-bet+ RORγt-protein- ILC1 and identification of NK1.1+RORγt-fate map(FM)+ ex-ILC3 in one day old Rorc(gt)cre/wt × R26eYFP newborn mice. Quantification of frequencies and absolute numbers of ex-ILC3 as mean ± SEM, n=6 examined over 2 independent experiments. (f) Representative SI gating on RORγt-protein+CD4+ LTi cells and identification of T-bet-protein-T-bet-FM+ ILC3 in one day old Tbx21cre/wt × R26eYFP newborn mice. Quantification of frequencies and absolute numbers of T-bet-FM+ LTi cells as mean ± SEM, n=5 examined over 2 independent experiments. Detailed statistics are available in source data.

