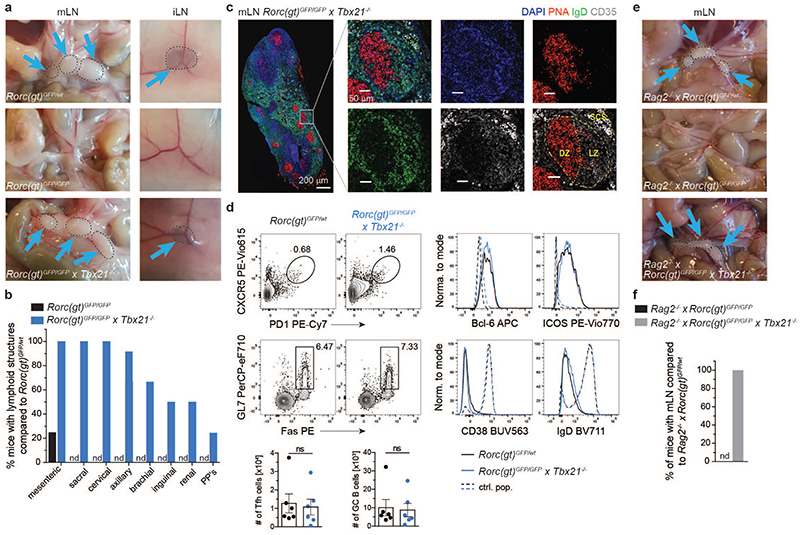
Fig. 4. T-bet deficiency rescues formation of LN in RORγt-deficient mice.
a, Photos of mesenteric or inguinal lymph nodes (mLN, iLN) of adult animals in indicated mouse strains. (b) Quantification (n=12) of frequencies of mice with lymphoid structures compared to control mouse strain Rorc(gt)GFP/wt in adult animals. PP’s, Peyer’s patches; nd, not detected. Data are representative of 2 independent experiments. (c) Immunofluorescence of mLN in Rorc(gt)GFP/GFP × Tbx21-/- mice. DZ, dark zone; LZ, light zone; SCS; subcapsular sinus. Data are representative of one experiment. (d) Representative flow cytometric plots of T follicular helper (Tfh) cells (upper row, gated as LD-CD45+CD3+CD4+CXCR5+PD1+) and germinal center (GC) B cells (lower row, gated as LD-CD45+CD3-B220+CD19+GL7+Fas+). Histograms show expression of Bcl-6 and ICOS in Tfh cells, control population consists of non-Tfh CD4+ T cells; and CD38 as well as IgD expression in GC B cells, control population consists of non-GC B cells. Black line represents Rorc(gt)GFP/wt mice, blue line represents Rorc(gt)GFP/GFP × Tbx21-/- mice. Quantification of Tfh and GC B cells in the different mouse strains. Frequencies are shown as mean ± SEM, data are representative of 2 independent experiments, n=6. Mann-Whitney U test; ns, not significant. (e) Photos of mesenteric or inguinal lymph nodes (mLN, iLN) of adult animals in indicated mouse strains. (f) Quantification (n=12) of frequencies of mice with lymphoid structures compared to control mouse strain in adult animals; nd, not detected. Detailed statistics are available in source data.

