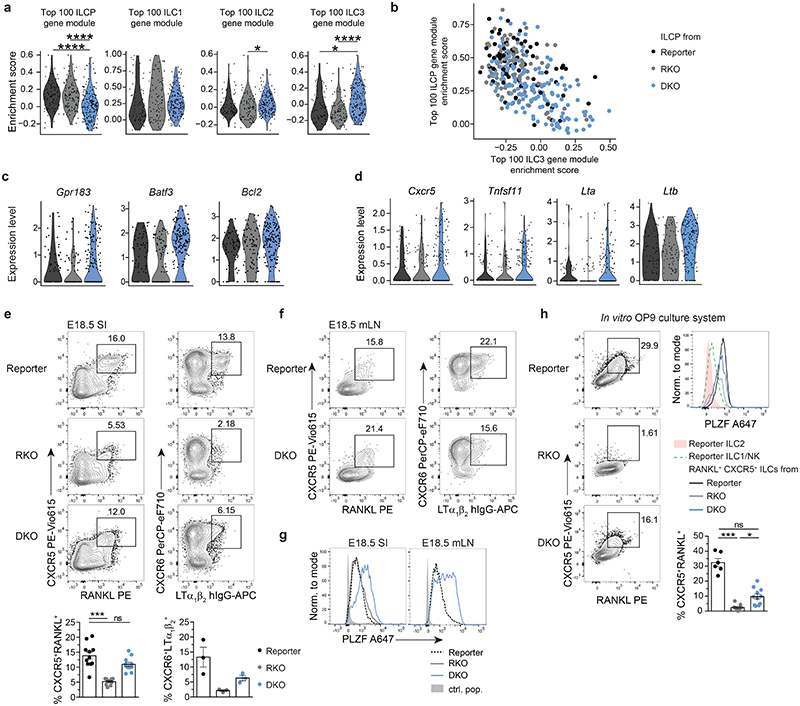
Fig. 6. PLZFhi ILCP from DKO mice are enriched in cells with LTi signatures.
a, Violin plots for enrichment score of gene modules of top 100 differentially expressed genes from ILCP or ILC1, ILC2, ILC3 cluster, defined in reporter mice, in single cells from ILCP cluster in indicated mouse strains. E18.5 scRNA-seq dataset, legend see in (b). Statistical significance was calculated using two-sided Wilcoxon test with Bonferroni correction. (b) Co-enrichment plots of ILCP versus ILC3 gene modules within single cells of ILCP cluster in mouse strains. (c,d) Expression of selected ILC3-associated genes in single cells of ILCP cluster. See legend in B. (e) Flow cytometric analysis from E18.5 SI after gating on LinLD-CD45+CD127+ and/or CD122+ cells. Quantification of CXCR5+RANKL+ (n=11, 3 independent experiments) and CXCR6+LTα1β2+ (n=3, one experiment) cells in the different mouse strains shown as mean ± SEM, Kruskal-Wallis significance and Dunn’s correction. (f) Representative flow cytometric plot of pooled E18.5 mLN anlagen gated on LinLD-CD45+CD127+ and/or CD122+ cells. (g) Representative flow cytometric histogram of LinLD-CD45+CD127+ and/or CD122+CXCR6+ cells; control population (ctrl. pop.) defined as CD127-CD122- of reporter mice. (h) In vitro differentiation of E14.5 fetal liver-derived ILC progenitors on OP9 stromal cells after culture for 5-8 days in the presence of SCF and IL-7 and analysis by flow cytometry. Representative flow cytometry plots of CXCR5+RANKL+ cells among LinLD-CD45+GATA3hi-negNK1.1- in the different mouse strains. Quantification shown as mean ± SEM, data are representative of 2-3 independent experiments (reporter n=5, 2 independent experiments, RKO n=9 and DKO n=11, 3 independent experiments). Kruskal-Wallis significance and Dunn’s correction. Detailed statistics are available in source data.

