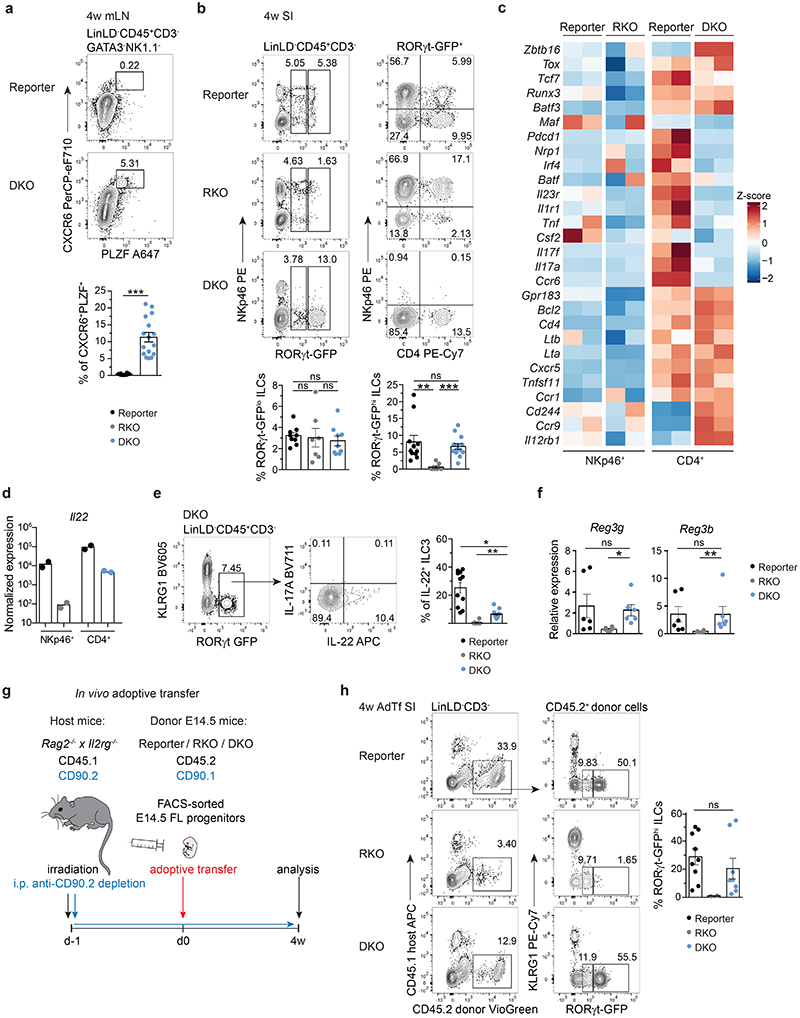
Fig. 7. PLZFhi CXCR6+ GFP+ cells persist in mLN and intestine of adult Rorc(gt)GFP/GFP × Tbx21-/- mice.
a, Flow cytometry representative plots of mLN from 4-week-old reporter (Rorc(gt)GFP/wt) and DKO (Rorc(gt)GFP/GFP × Tbx21-/-) mice. Quantification of frequencies from 3 independent experiments (reporter n=8, DKO n=16), mean ± SEM and Mann-Whitney-U testing. (b) Representative flow cytometry plots of SI from indicated mouse strains at 4 weeks of age. Quantification of RORγt-GFPlo and RORγt-GFPhi populations depicted as mean ± SEM, Kruskal-Wallis testing with Dunn’s multiple correction, reporter n=9, RKO n=7, DKO n=9 from 3 independent experiments. See legend in (a). (c) Heatmap of bulk RNA-seq of RORγt-GFP+ population sort-purified according to NKp46 or CD4 expression isolated from SI of 4-week-old mice. Selected gene transcripts are shown as Z-score. (d) Normalized expression values of Il22 transcripts from bulk RNA-seq dataset and (e) IL-22 protein expression in SI of DKO mice determined by flow cytometry. Quantification of frequencies from 3 independent experiments (reporter n=11, RKO n=14, DKO n=15), mean ± SEM and Kruskal-Wallis testing with Dunn’s multiple correction. (f) Expression of Reg3g and Reg3b in intestinal epithelial compartment determined by quantitative PCR. Values are normalized to housekeeping genes Actb, Hprt and Gapdh. Each symbol represents an individual mouse. Data show mean ± SEM, Kruskal-Wallis testing with Dunn’s multiple correction, n=6. (g) Schematic overview of experimental setup for adoptive transfer experiment. FL, fetal liver. (h) Representative flow cytometry in SI of Rag2-/- × II2rg-/- mice 4 weeks after adoptive transfer and quantification of frequencies of RORγt-GFPhi ILCs as mean ± SEM (reporter n=9, RKO n=2, DKO n=8), Kruskal-Wallis significance with Dunn’s correction. Data are representative of 2 experiments. Detailed statistics are available in source data.

