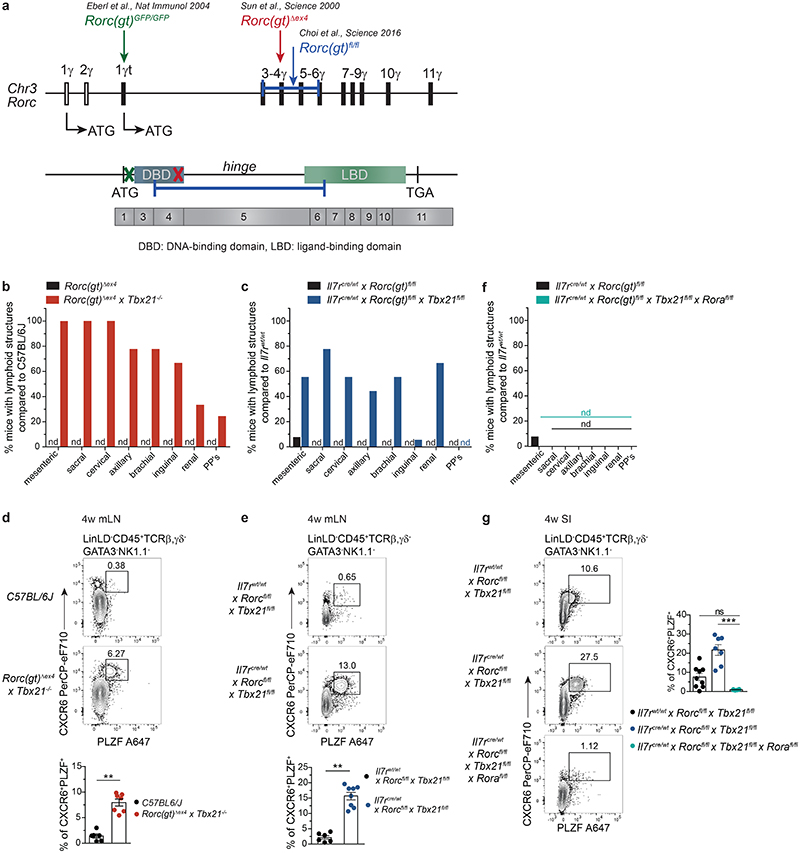
Fig. 8. LN formation and accumulation of PLZF+ ILCP is independent of DNA- and ligand-binding domains of RORγt and promoted by RORα in the absence of T-bet.
a, Schematic overview on Rorc locus on chromosome 3 (Chr3) and genetic targets in designated mouse strains. (b,c,f) Quantification (n=12) of frequencies of mice with lymphoid structures compared to control mouse strain in adult animals. PP’s, Peyer’s patches; nd, not detected. (d,e,g) Flow cytometry representative plots of mLN (d,e) or SI (g) from 4-week-old mice of indicated mouse strains. (d) Quantification of frequencies from 2 independent experiments as mean ± SEM, C57BL/6J n=6, Rorc(gt)Δex4 × Tbx21-/- n=7, Mann-Whitney-U testing (e) Quantification of frequencies from 2 independent experiments as mean ± SEM, Il7rwt/wt × Rorcfl/fl × Tbx21fl/fl n=6, Il7rcre/wt × Rorcfl/fl × Tbx21fl/fl n=7, Mann-Whitney-U testing. (g) Quantification of frequencies from 2 independent experiments as mean ± SEM, Il7rwt/wt × Rorcfl/fl × Tbx21fl/fl n=9, Il7rcre/wt × Rorcfl/fl × Tbx21fl/fl n=7, Il7rcre/wt × Rorcfl/fl × Tbx21fl/fl × Rorafl/fl n=6, Kruskal-Wallis testing with Dunn’s multiple correction. Detailed statistics are available in source data.

