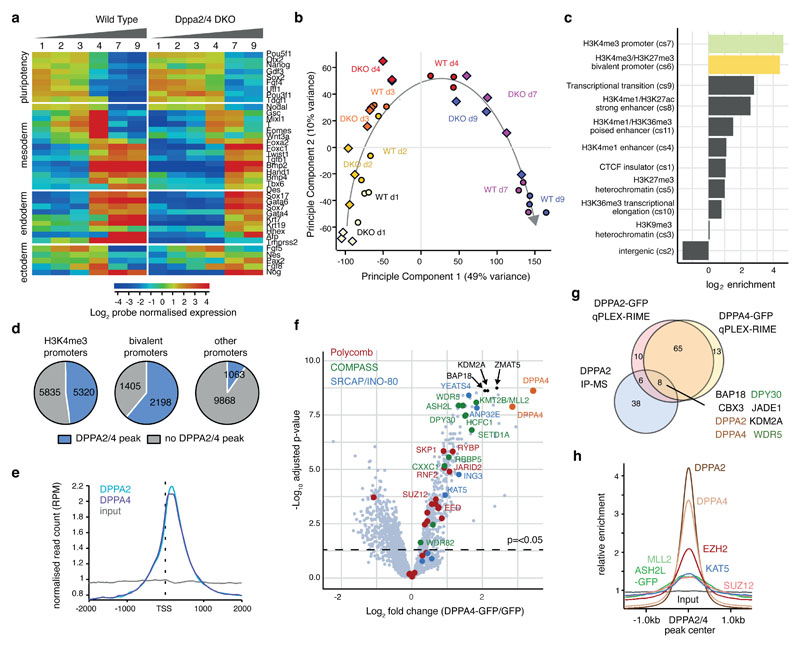
Figure 1. Dppa2/4 are required for differentiation and bind developmental bivalent promoters.
(A) Per gene normalised heatmap showing expression of pluripotency, endoderm, mesoderm and ectoderm genes across 9 days of embryoid body differentiation in WT and Dppa2/4 DKO cells as measured by RNA-sequencing. The plot shows pooled data from three differentiation timecourses ran on different days using 1 WT and 1 DKO clone. (B) Principle component analysis of embryoid body time course RNAseq gene expression depicting WT (circles) and Dppa2/4 DKO (diamonds). Developmental trajectory is shown by the arrow. (C) Log2 enrichment of Dppa2/4 peaks amongst 12 chromatin states (cs1-12) defined using ChromHMM models (see Materials and Methods). Chromatin state 12, which represents low signal/repetitive elements contained no peaks and is not shown. (D) Proportion of H3K4me3 bound (left), bivalent (middle) and other (right) promoters containing a Dppa2/4 peak (blue). (E) Relative average read density for DPPA2 (blue) and DPPA4 (purple) ChIP-seq data across a 3kb region centred around the transcription start site (TSS). Input (grey) is shown as a control. Data reanalysed from 10 [GSE117173]. (F) qPLEX-RIME results showing log2fold change between Dppa4-GFP and GFP control versus -log10(adjusted p-value). Dotted line represents cut off of p<0.05 or -log10 adjusted p-value of 1.30 as determined by qPLEXanalyzer 18. DPPA2 and DPPA4 are shown in orange. Top 3 interactors are shown in black. Members of Polycomb (red), COMPASS (green) and SRCAP/INO-80 (blue) complexes are highlighted. n = 2 WT, Dppa2 and Dppa4-GFP clones each in triplicate where replicates were harvested on different days separated by at least once cell passage. The Scatter plot is of pooled data from the two clones and three replicates. (G) Overlap between DPPA2 and DPPA4 qPLEX RIME results with co-immunoprecipitation mass spectrometry results for endogenous DPPA2 from 10 [GSE117173]. (H) Probe trend plot showing relative enrichment across DPPA2/4 peaks. Input, DPPA2 and DPPA4 ChIP data reanalysed from 10 [GSE117173], ASH2L-GFP data from 1 [GSE52071], MLL2 data from 31 [GSE48172], EZH2 and SUZ12 data from 32 [GSE48435] and KAT5/TIP60 data from 33 [GSE69671].

