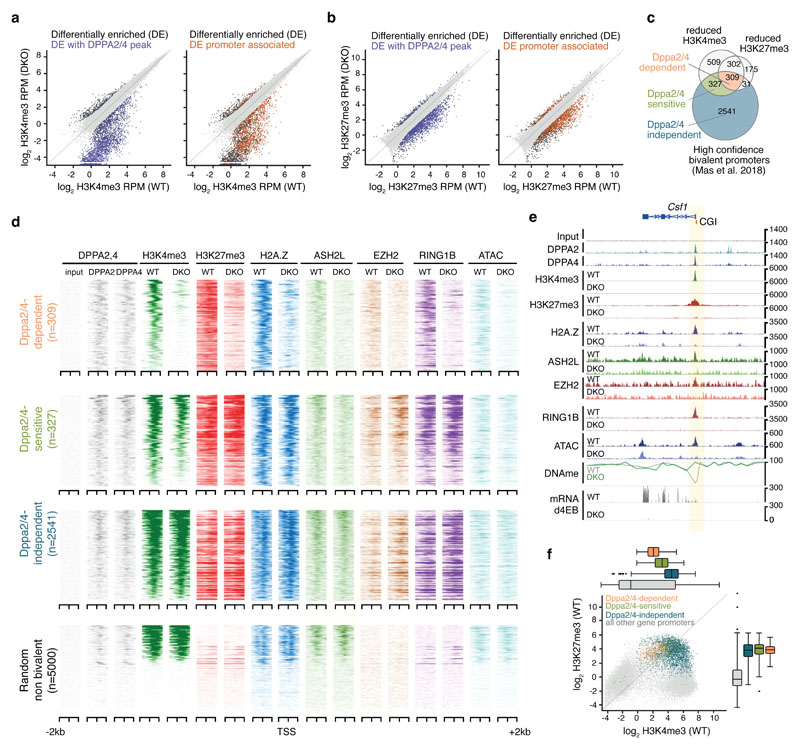
Figure 2. Dppa2/4 are required to maintain bivalent chromatin at a subset of developmental genes.
(A) Scatter plots showing H3K4me3 enrichment as log2 RPM at H3K4me3 peaks in WT and Dppa2/4 DKO cells. Differentially enriched peaks (DESeq2 adjusted p-value <0.05 with >2-fold change are shown in dark grey with those overlapping Dppa2/4 peaks (purple) or promoters (orange) highlighted. Scatter plots show pooled data from three independent cellular clones. (B) similar to A but showing H3K27me3 peaks. (C) Overlap between promoters (TSS +/-1kb) with reduced H3K4me3 or H3K27me3 enrichment in Dppa2/4 DKO cells (this study) with bivalent gene promoters as defined by 15. (D) Aligned probe plots of wild type (WT) and Dppa2/4 double knockout (DKO) ESCs showing DPPA2 and DPPA4 (grey), H3K4me3 (dark green), H3K27me3 (dark red), H2A.Z (blue), ASH2L (light green), EZH2 (orange) and RING1b (purple) at transcriptional start site (TSS) +/- 2kb of Dppa2/4-dependent (top) and Dppa2/4-independent (middle) promoters versus a random subset of not bivalent promoters (bottom). Chromatin accessibility measured by ATACseq is shown in light blue. All data from this study. (E) Genome browser view of a Dppa2/4-dependent gene locus Csf1 showing different chromatin marks, chromatin accessibility (ATAC-seq), DNA methylation (DNAme) and transcription at day 4 of embryoid body differentiation for wild type (WT) and Dppa2/4 double knockout (DKO) ESCs. Promoter region is highlighted in pale yellow, CpG island (CGI) denoted by orange box. (F) Scatterplot showing levels of H3K4me3 and H3K27me3 in wild type cells at gene promoters using ChIP-seq data from 3 independent cellular clones, highlighting Dppa2/4-dependent (apricot), -sensitive (green) and -independent (teal) promoters. Box plots of are shown on top (H3K4me3) and right (H3K27me3) where the central line denotes the median, the yellow box the 25th and 75th percentile of the data and the black whiskers the median +/- the interquartile range (25-75%) multipled by 2. Circles represent single promoters that fall outside this range. Dppa2/4 dependent n = 309 promoters; Dppa2/4 sensitive n = 327 promoters; Dppa2/4 independent n = 2,541 promoters.

