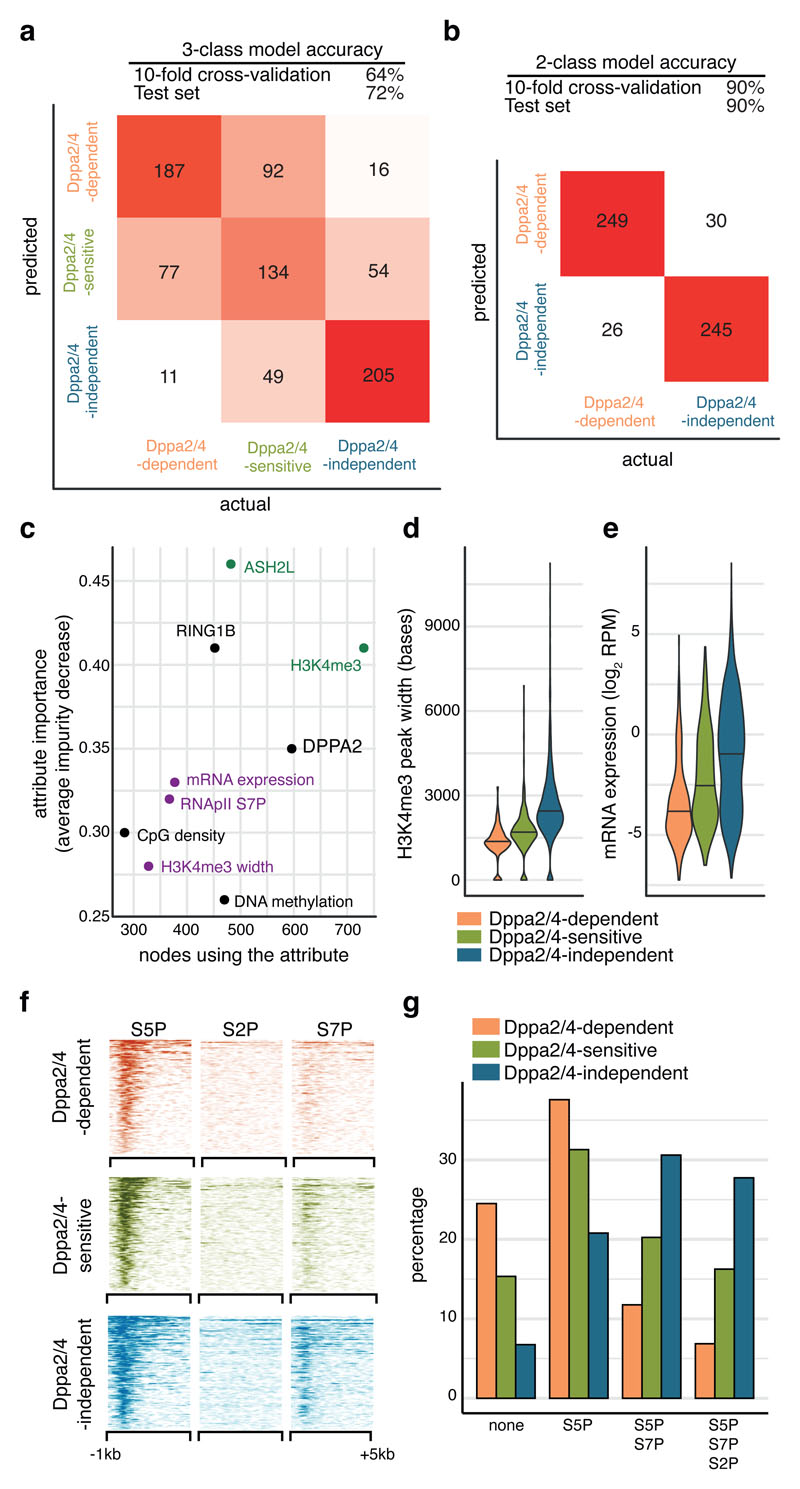
Figure 3. Dppa2/4-dependent bivalent genes characterised by low H3K4me3, low expression and initiating but not elongating RNA polymerase II.
(A, B) Overall accuracy and confusion matrices for Random Forest promoter classification predicting either three (A) or two classes (B). The heatmap shows numbers of correctly and incorrectly classified promoters from a class balanced training set. (C) Ranking of the most predictive attributes in the 2-class Random Forest model showing average impurity decrease and number of nodes using each attribute. Those related to COMPASS are shown in green, those related to gene expression in purple. (D) H3K4me3 peak width at promoters in wild type ESCs (pooled ChIP-seq from 3 cellular clones) where the central line represents the median. (E) Expression of genes in WT ESCs (pooled RNA-seq from 3 cell clones). Dppa2/4 dependent n = 309 promoters; Dppa2/4 sensitive n = 327 promoters; Dppa2/4 independent n = 2,541 promoters. (F) Aligned probe plots showing enrichment of different RNA polymerase II modifications at gene transcription start sites from 1kb upstream to 5kb downstream of TSS. Data reanalysed from 22 [GSE34520]. (G) Percentage genes with different combinations of RNApII modifications. Data reanalysed from 22 [GSE34520].

