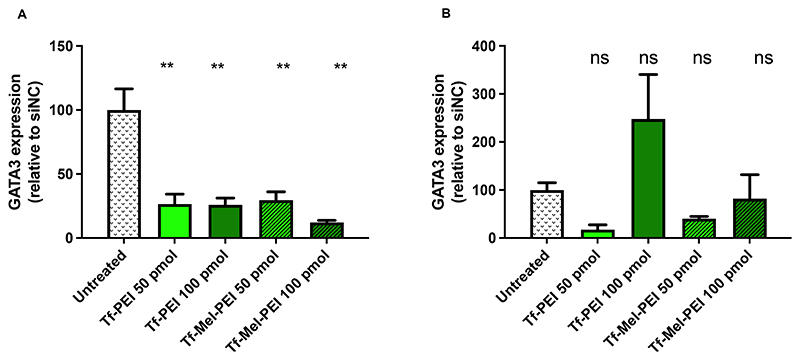
Figure 6.
GATA3 knockdown in activated (A) and non-activated (B) human PCLS transfected with Tf-PEI and T-Mel-PEI polyplexes encapsulating 50 or 100 pmol of GATA3 siRNA as measured by qRT-PCR and normalized to β-actin expression. Each value is normalized to the GATA3/β-actin expression after treatment with negative control siRNA at the same conditions. Data points indicate mean ± SD. One way ANOVA, **p<0.01.

