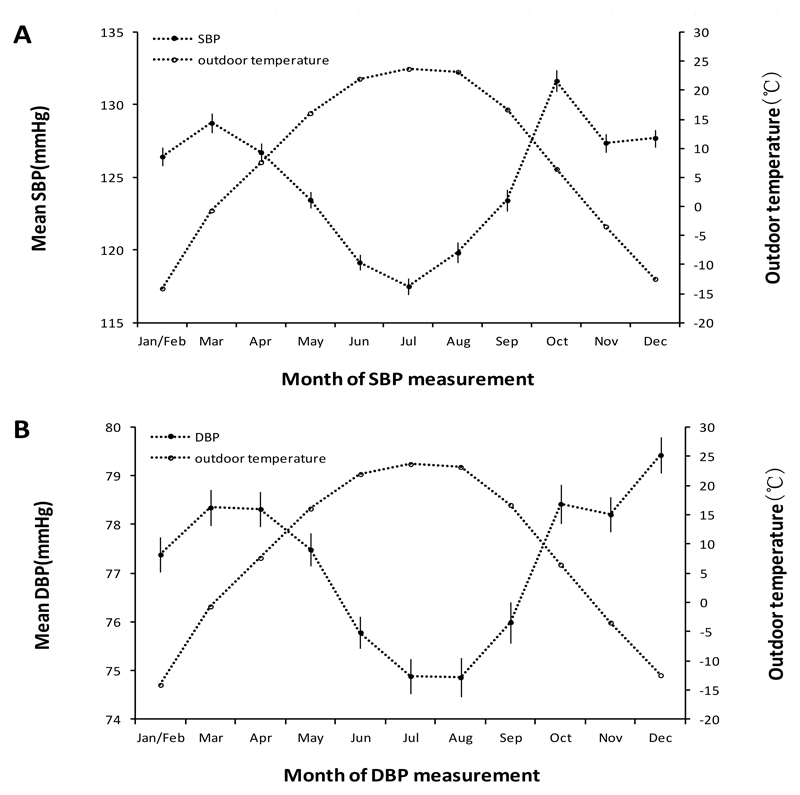
Figure 3. Monthly variations in mean outdoor temperature and blood pressure.
A SBP (Systolic Blood Pressure). B DBP (Diastolic Blood Pressure). Jan/Feb = January and February combined (recruitment dropped in January and February due to the Chinese New Year). For both outdoor temperature and blood pressure, the mean monthly values are the mean for all participants whose baseline survey happened during that month (regardless of the year).

