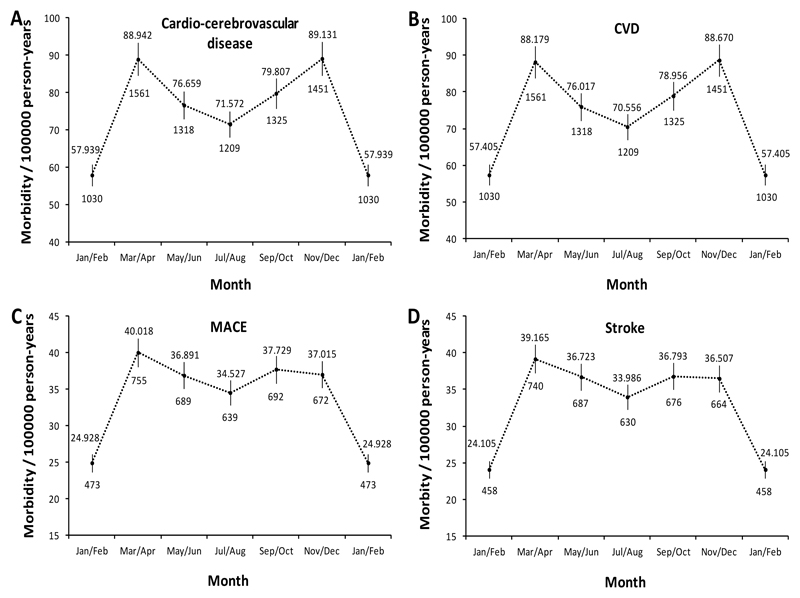
Figure 4. Monthly variation in cardio-cerebrovascular events morbidity.
A Cardio-cerebrovascular disease. B Cardiovascular disease. C MACE (major adverse cardiovascular events). D Stroke. To make the curve smoother, two calendar months are combined. Vertical lines indicate the corresponding 95% CI (confidence intervals). Numbers above confidence intervals are of mortalities (per 100000 person-years) and those below are the cases of various cardio-cerebrovascular events. Cardio-cerebrovascular events morbidities are calculated using population excluding those taking antihypertensive drugs.

