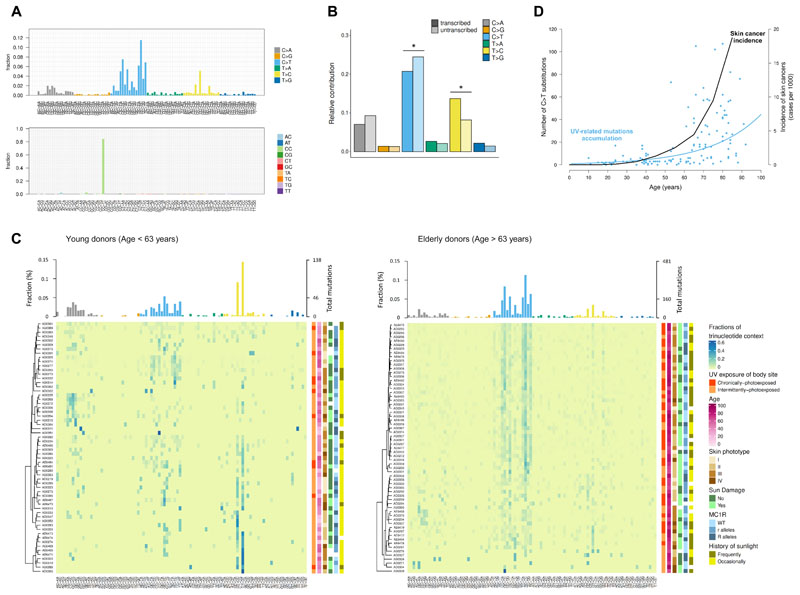
Figure 2. Spectrum of somatic mutations in normal epidermis.
(A) Bar plot showing the fraction of single (top) and doublet (bottom) base substitutions found in each of the possible 96 trinucleotide contexts (strand independent). (B) Relative number of each substitution type present on the transcribed (dark shading) and untranscribed strand (light shading). Asterisks indicate significant transcriptional strand asymmetries (Poisson test). (C) Mutational spectra in samples from young (left) and elderly donors (right). Heatmaps show the fraction of each trinucleotide change in each sample (middle). Bar plots represent the contribution mean of each 96-mutation type per age group (top). Clinical and demographic characteristics are presented next to each sample (right). (D) Age-dependent increase of both UV-mutation accumulation and skin cancer incidence. Data of skin cancer incidence in Spain was downloaded from the Global Cancer Observatory (http://gco.iarc.fr).

