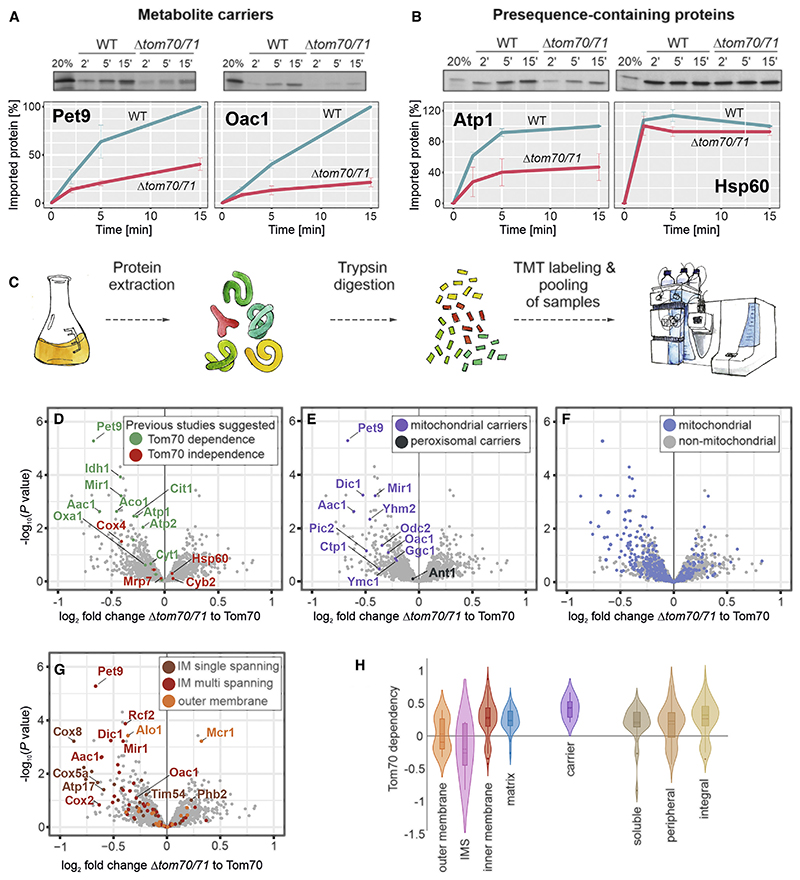
Figure 1. Identification of Tom70/71 clients.
(A and B) Radiolabeled Atp1, Hsp60, Pet9, and Oac1 were incubated with isolated wild-type and Δtom70/71 mitochondria for the times indicated at 25°C. Non-imported protein was removed by treatment with proteinase K, and samples were analyzed by SDS-PAGE and autoradiography. Graphs show mean values and standard deviations from three independent experiments.
(C) The proteomes of different mutants were compared using quantitative proteomics and multiplexing (see also Figure S1A).
(D–G) The proteomes of Δtom70/71 cells carrying either empty or Tom70-expressing plasmids (three biological replicates each) were measured by mass spectrometry. Shown are the mean values of the ratios obtained from Δtom70/71 (30°C) to Tom70-expressing cells (30°C) plotted against their statistical significances (p values). The points in the top left corner show the highest Tom70 dependence. The data point for Tom70 is shown in Figure S1B. Different groups of proteins are indicated in the same dataset. IM, inner membrane.
(H) The relative depletion of proteins in the Δtom70/71 to Tom70 comparison (log2 fold changes [FCs]) were taken as proxy for the Tom70 dependence of proteins. Shown are the distributions of these Tom70 dependence values for different groups of mitochondrial proteins (Morgenstern et al., 2017).

