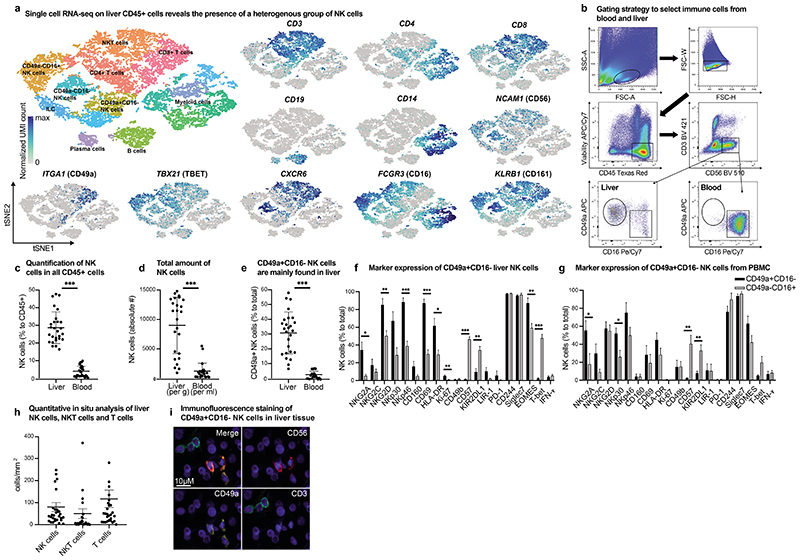
Figure 1. Human liver NK cells display a unique heterogeneity and contain a CD49a+ CD16- subpopulation.
a, tSNE projection of human hepatic CD45+ leukocytes. Each cell is grouped into one of 15 clusters (distinguished by their colors). UMI normalized expression of indicated genes within the depicted clusters. b, Gating strategy for CD49a+CD16- and CD49a- CD16+ NK cells from human liver mononuclear cells isolated of liver tissue and PBMCs. c, The percentage of total CD56+ NK cells in human liver and blood of total CD45+ leukocytes assessed by flow cytometry and presented as mean percentage of positive cells ± SD. n = 27. ***P < 0.0001. d, Mean numbers of NK cells in liver per gram and blood per ml assessed by flow cytometry and presented as mean absolute number of positive cells ± SD. n = 27. ***P < 0.0001. e, Mean percentage of CD49a+CD16- NK cells of total CD56+ NK cells in liver and blood. n = 27. ***P < 0.0001. f-g, Mean of intra- and extracellular markers of NK cells from the liver (f) and blood (g) according to their CD49a expression assessed by flow cytometry and depicted as percentage of positive cells ± SD. n = 5 (liver), 8 (blood). *P < 0.01, **P < 0.001, ***P < 0.0001. h, Quantitative in situ analysis of human livers of NK cells (CD56+CD3-), NKT cells (CD56+CD3+) and T cells (CD56-CD3+) by multicolor immunofluorescence staining. Data are given as absolute numbers of positive cells per mm2 ± SD. n = 30. i, Representative image of multicolor immunofluorescence staining of NK cells (CD56 PE/CD49a A647/ CD3 FITC) in human liver tissue.

