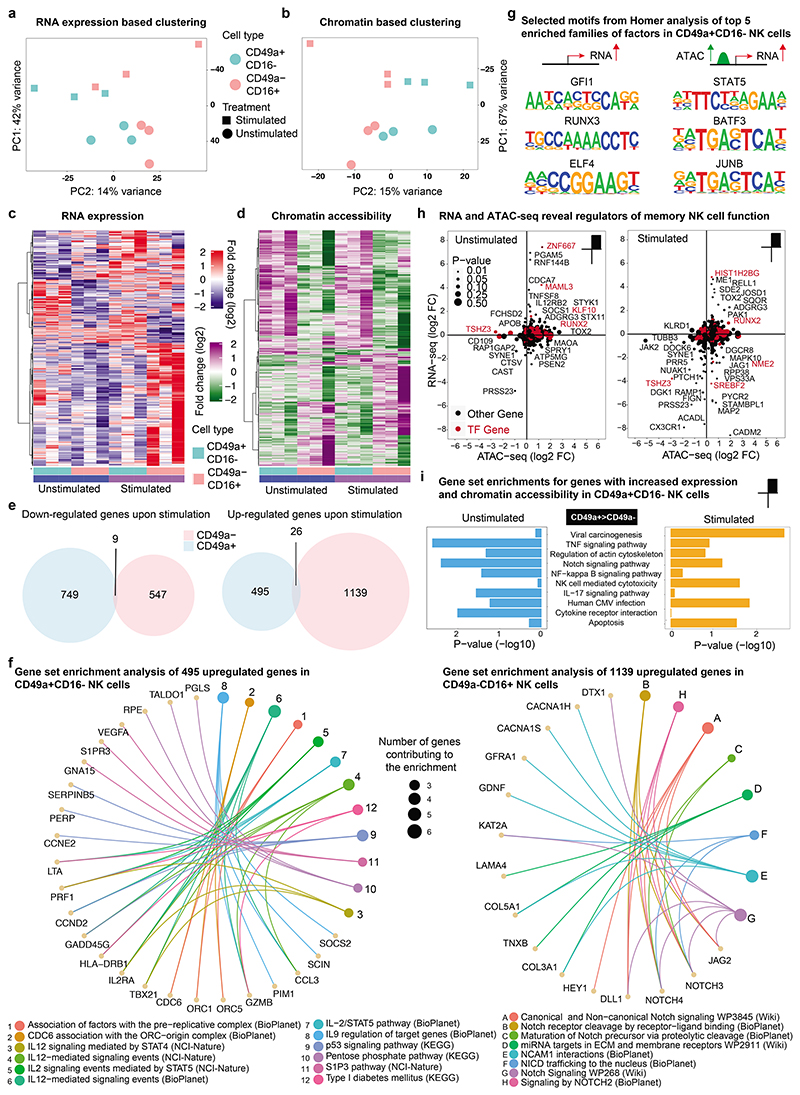
Figure 2. Transcriptomic and epigenomic differences in NK cell subtypes reveal priming of CD49a+CD16- NK cells for activation of genes with effector function.
a-i, CD49a+CD16- and CD49a-CD16+ NK cells were sorted from human liver from 3 donors by flow cytometry and stimulated with IL-2/IL-15. Smart-seq2 RNA sequencing and ATAC-seq was performed before and after stimulation. a, PCA analysis of bulk Smart-seq2 RNA-seq data on differentially expressed genes (P < 0.05) comparing unstimulated and IL-2/IL-15-stimulated CD49a+CD16- and CD49a-CD16+ NK cells. b, PCA analysis of ATAC-seq data on differentially accessible (DA) regions (P < 0.05) in CD49a+CD16- vs CD49a-CD16+ NK cells comparing unstimulated and IL-2/IL-15-stimulated cells. c, Heatmap of differentially expressed genes assessed by Smart-seq2 under stimulated and unstimulated conditions in CD49a+CD16- and CD49a-CD16+ subtypes. d, Heatmap of differentially accessible (DA) regions revealed by ATAC-seq between CD49a+CD16- vs CD49a-CD16+ NK cells under stimulated and unstimulated conditions. e, Venn diagram representing the number of up- and down-regulated genes in CD49a+CD16- and CD49a-CD16+ NK cells comparing stimulated versus unstimulated conditions. f, Functional enrichment (from BioPlanet 2019, KEGG 2019 Human, NCI-Nature 2016, and WikiPathways 2019 Human) analysis of 495 upregulated genes in CD49a+CD16- NK cells (left) and enrichment analysis of 1139 upregulated genes in CD49a-CD16+ NK cells (right). g, Selected consensus binding sequences resulting from HOMER motif enrichment analysis out of the top 5 enriched families of factors in CD49a+CD16- NK cells. h, Scatter plots of log2 fold changes from DA regions and differentially expressed genes, comparing CD49a+CD16- vs CD49a-CD16+ NK cells under stimulated and unstimulated conditions. Transcription factors are marked in red color. i, Enrichment of Top 10 selected KEGG pathways in stimulated and unstimulated conditions for genes with increased expression and accessibility profile.

