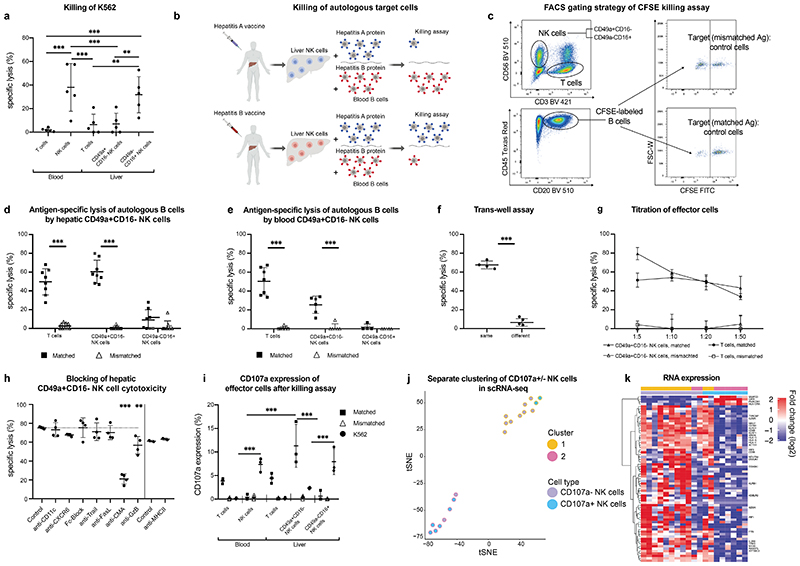
Figure 3. Human liver NK cells recognize and discriminate between matched and mismatched viral antigens.
a, Killing of K562 cells by hepatic CD49a+CD16- NK cells, CD49a-CD16+ NK cells and CD3+ T cells from blood and liver. Results are presented as percentage of specific lysis ± SD. n = 5. ** P < 0.01, *** P < 0.001. b, Graphical abstract of experiments assessing antigen-specific killing of hepatitis A/B-incubated autologous B cells by NK cells of vaccinated individuals c, Gating strategy for the cytotoxicity assay of hepatic NK cells and T cells. Autologous B cells of the patients pulsed with either hepatitis A or B and labelled with different concentrations of CFSE. Killing (“specific lysis”) is determined as the difference in the ratio of Ag-pulsed target B cells (CFSE low) and non-pulsed, intra-well control B cells (CFSE high). d-e, Killing of B cells pulsed with “Matched” or “Mismatched” antigens (either hepatitis A or B antigens according to hepatitis A or B serology) by hepatic NK cells (d) or blood derived NK cells (e) and CD8+ T cells as controls. The effector: target cell ratio was 1:10. Data represent the mean specific lysis ± SD of triplicates of each individual. Grey plots indicate individuals after hepatitis A/B infection. n = 6-8. ***P < 0.0001. f, Percentage of specific lysis of autologous B cells pulsed with matched antigens by NK cells in different and same wells in trans-well assays. n = 4. ***P < 0.0001. g, Titration of hepatic CD49a+CD16- NK cells, T cells and CD49a-CD16+ NK cells as effector cells and against target cells (B cells). Results are depicted as percentage of specific lysis ± SD. n = 4. h, Neutralizing antibodies or blocking agents were added to hepatic CD49a+CD16- NK cell cytotoxicity and compared to an isotype antibody control (dotted line). anti-FasL: anti-Fas Ligand. CMA: Concanamycin A, anti-GzB: anti-Granzyme B. n=4. **P < 0.01, ***P < 0.0001. i, Percentage of CD107a expression of depicted cells of blood and liver after killing assay of effector cells against autologous B cells incubated with matched, mismatched (according to serology status) and K562 cells. n=3, ***P < 0.001. j-k, Single-cell Smart-seq2 sequencing was performed on FACS-purified CD107a+CD49a+CD16- NK cells and CD107a-CD49a+CD16- NK cells after an antigen-specific cytotoxicity assay (shown in Fig.3i). j, Separate clustering of CD107a+/- NK cells after antigen-specific killing assay. k, Heat map of differentially expressed genes in the two identified clusters of CD107a+/- CD49a+CD16- NK cells.

