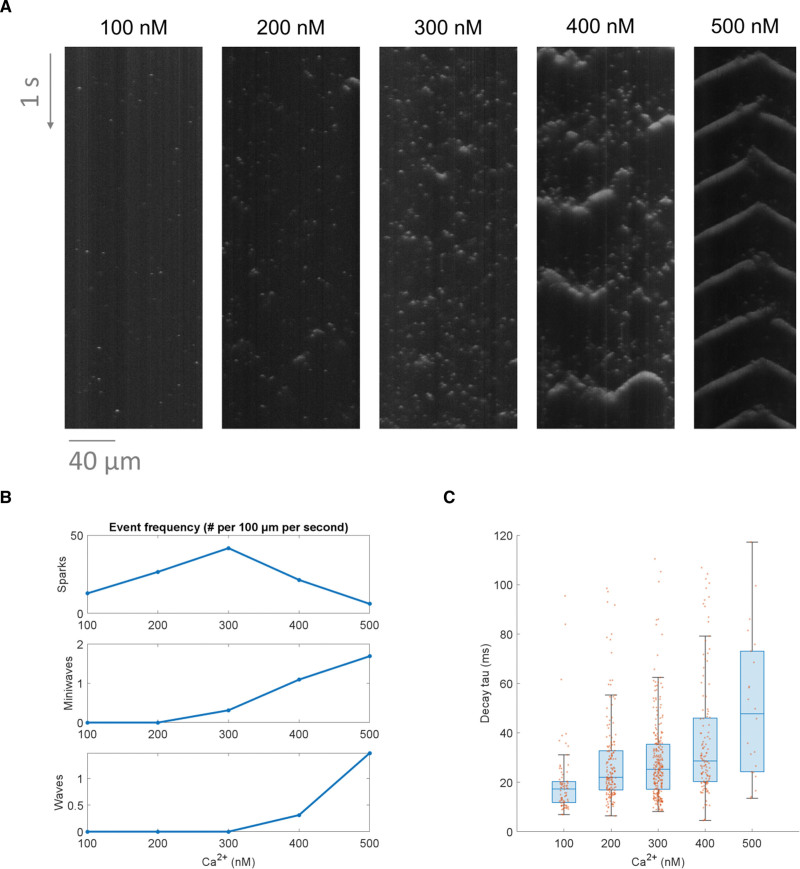
Figure 3.
Using SparkMaster 2 (SM2) to analyze the effect of increasing [Ca]i on Ca release events. A, A comparison of the Ca release patterns in 5 distinct permeabilized cells exposed to a variety of calcium concentrations. B, A summary of frequencies of Ca sparks, miniwaves, and waves, in the 5 recordings above. C, A comparison of calcium spark decay time constants across the different concentrations (using standard boxplots in blue and the underlying data points in orange). To focus this analysis on sparks only, Ca miniwaves and waves were excluded, as well as sparks with decay time constant over 120 ms, indicating an incorrectly segmented object or the failure of the time constant fitting procedure.

