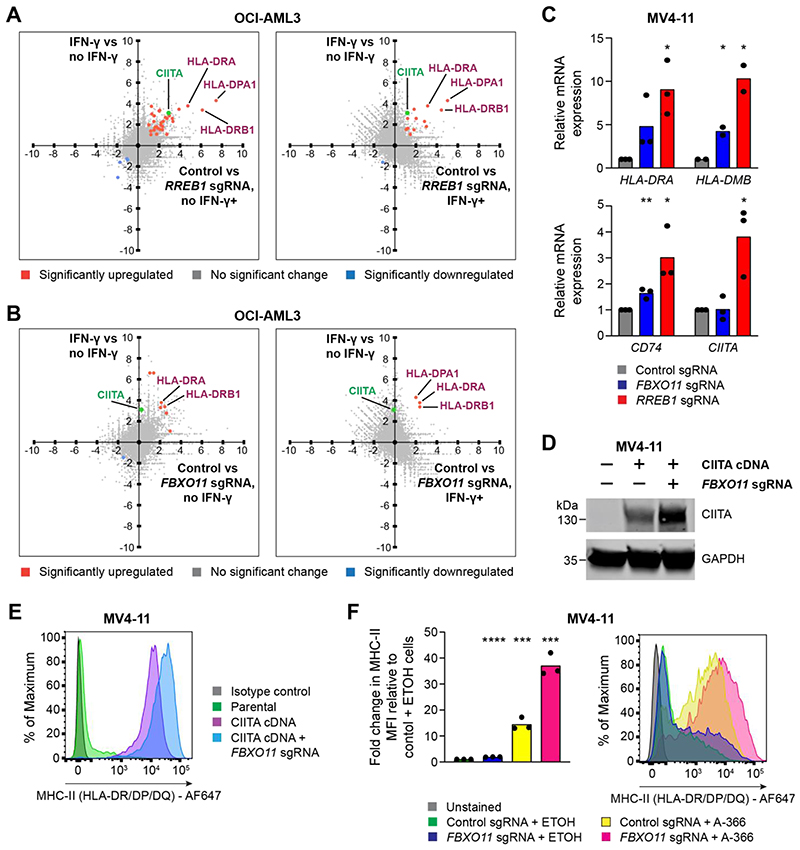
Figure 3. The CtBP complex and FBXO11 synergistically regulate MHC-II in AML.
(A and B) RNA-seq correlation plots showing differential gene expression in OCI-AML3 cells in the presence or absence of IFN-γ 25 ng/mL for 48 hours (Y-axis) and OCI-AML3 Cas9 cells transduced with control and RREB1 (A) or FBXO11 (B) sgRNA in the presence or absence of IFN-γ 25 ng/mL for 48 hours (X-axis). Fold change > 1.0 and false discovery rate < 0.05 for highlighted genes (in blue and orange) with significant differential gene expression. CIITA is labelled separately in green and reaches significance only in the RREB1 sgRNA, no IFN-γ analysis.
(C)mRNA expression of MHC-II genes in MV4-11 Cas9 cells transduced with control, FBXO11 or RREB1 sgRNA. Bars depict mean fold change in expression from 3 independent experiments and points indicate the mean of technical triplicates from individual experiments. Statistical analysis by unpaired t test compared to control cells, with significant changes indicated; p value * < 0.05, ** < 0.01.
(D and E) Immunoblot (D) and cell surface MHC-II expression (E) in MV4-11 Cas9 cells transduced with a retroviral vector encoding CIITA cDNA and with or without FBXO11 sgRNA. Representative data from 2 experiments.
(F) Cell surface MHC-II expression and mean fold change in median fluorescence intensity (MFI) in MV4-11 Cas9 cells transduced with control or FBXO11 sgRNA and treated with EHMT1/2 inhibitor (A-366 1μM) or vehicle control (ETOH) for 7 days. Bars depict mean fold change in MFI from 3 independent experiments indicated by points. Statistical analysis by unpaired t test compared to control sgRNA + ETOH cells, with significant changes indicated; p value *** < 0.001, **** < 0.0001.
See also Figures S3 and S4.

