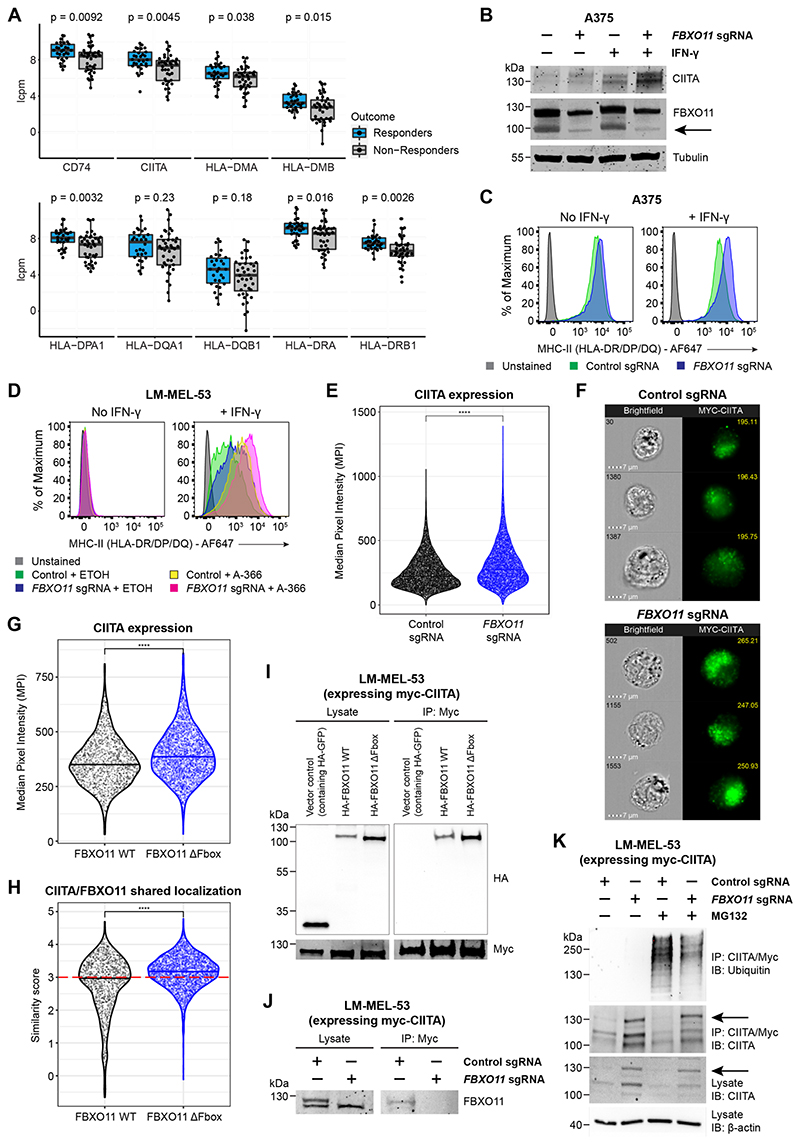
Figure 4. FBXO11 loss increases surface MHC-II expression through stabilization of CIITA.
(A)mRNA expression of MHC-II genes in tumor biopsy samples from melanoma patients treated with immune checkpoint inhibitors. The upper limit, center and lower limit of each box denotes the upper quartile, median and lower quartile of the data, respectively. P values were calculated using the Wilcoxon rank-sum test. Data are from ENA: PRJEB23709 (Gide et al., 2019). Y axes indicate log2 counts per million (lcpm).
(B and C) Immunoblot (B) and cell surface MHC-II expression (C) in A375 cells transduced with a retroviral vector encoding CIITA cDNA with or without FBXO11 sgRNA, in the presence or absence of IFN-γ 10 ng/mL for 48 hours. Representative data from 2 experiments.
(D)Cell surface MHC-II expression in LM-MEL-53 Cas9 cells transduced with control or FBXO11 sgRNA and treated with EHMT1/2 inhibitor (A-366 3μM) or vehicle control for 7 days, in the presence or absence of IFN-γ 10 ng/mL for 48 hours. Representative data from 2 experiments.
(E)Myc-CIITA expression measured as Median Pixel Intensity (MPI) in LM-MEL-53 Cas9 cells transduced with control or FBXO11 sgRNA. Each data point represents a single cell measured and bars represent the group median. Statistical significance was calculated using Dunn’s test with Bonferroni correction for multiple comparisons. **** = p < 0.0001. Representative data from 2 experiments.
(F)Representative images showing brightfield microscopy (cell number at top left) and Myc-CIITA expression (MPI value at top right) in LM-MEL-53 Cas9 cells transduced with control or FBXO11 sgRNA.
(G)Myc-CIITA expression measured as MPI in LM-MEL-53 cells expressing FBXO11 WT or FBXO11 ΔFbox. Each data point represents a single cell measured and bars represent the group median. Statistical significance was calculated using Dunn’s test with Bonferroni correction for multiple comparisons. **** = p < 0.0001. Representative data from 2 experiments.
(H)Summary of shared localization between CIITA and FBXO11 in LM-MEL-53 cells expressing FBXO11 WT or FBXO11 ΔFbox. High shared localization defined by similarity score ≥3 (red dotted line), as previously described (Beum et al., 2006; Erie et al., 2011; George et al., 2006). Statistical significance was calculated using Dunn’s test with Bonferroni correction for multiple comparisons. **** = p < 0.0001. Representative data from 2 experiments.
(I)Immunoprecipitation of myc-CIITA from lysates of LM-MEL-53 cells expressing FBXO11 WT or FBXO11 ΔFbox, analyzed by immunoblot. Lysate, 5% of input. Experiments performed twice.
(J)Immunoprecipitation of myc-CIITA from lysates of LM-MEL-53 Cas9 cells transduced with control or FBXO11 sgRNA, analyzed by immunoblot. Lysate, 5% of input. Experiments performed twice.
(K)Immunoprecipitation of myc-CIITA from lysates of LM-MEL-53 Cas9 cells transduced with control or FBXO11 sgRNA and with or without MG-132 treatment, analyzed by immunoblot. Lysate, 5% of input. Experiments performed twice.
See also Figures S4 and S5.

